Contents
- What is a sales funnel on a website?
- Which stages should a sales funnel include?
- How do you calculate funnel conversion?
- Case: an online store, from cart to placed order
- Case: dental clinics, from an article to an enquiry
- How do you tie the site, the CRM and the payment together?
- Where do you start building and checking a funnel?
- Frequently asked questions about sales funnels
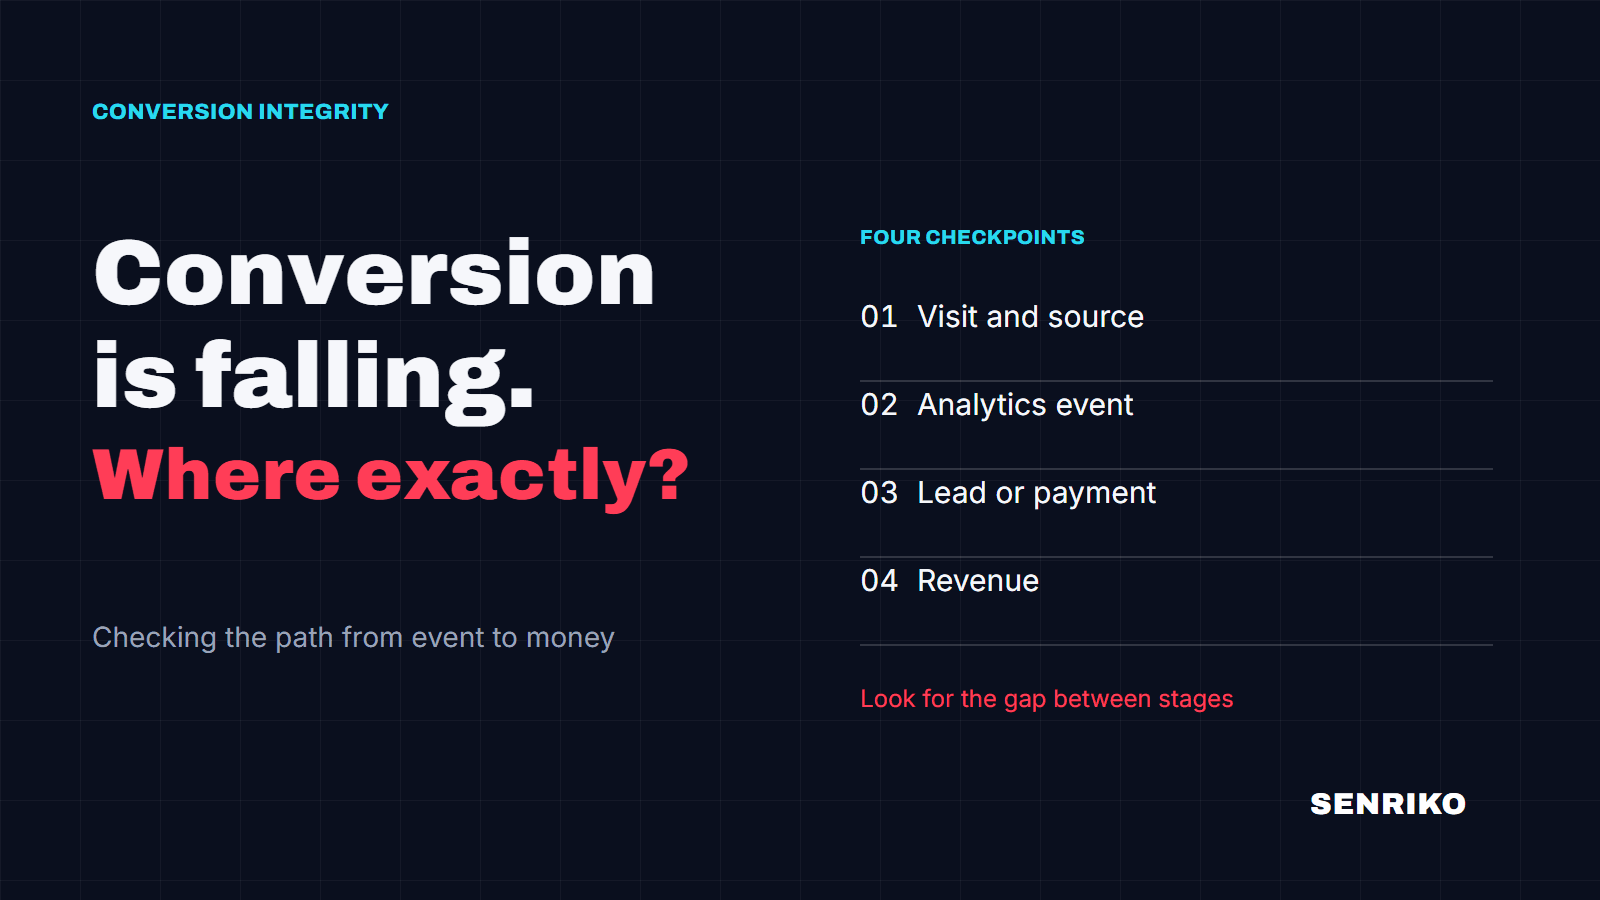
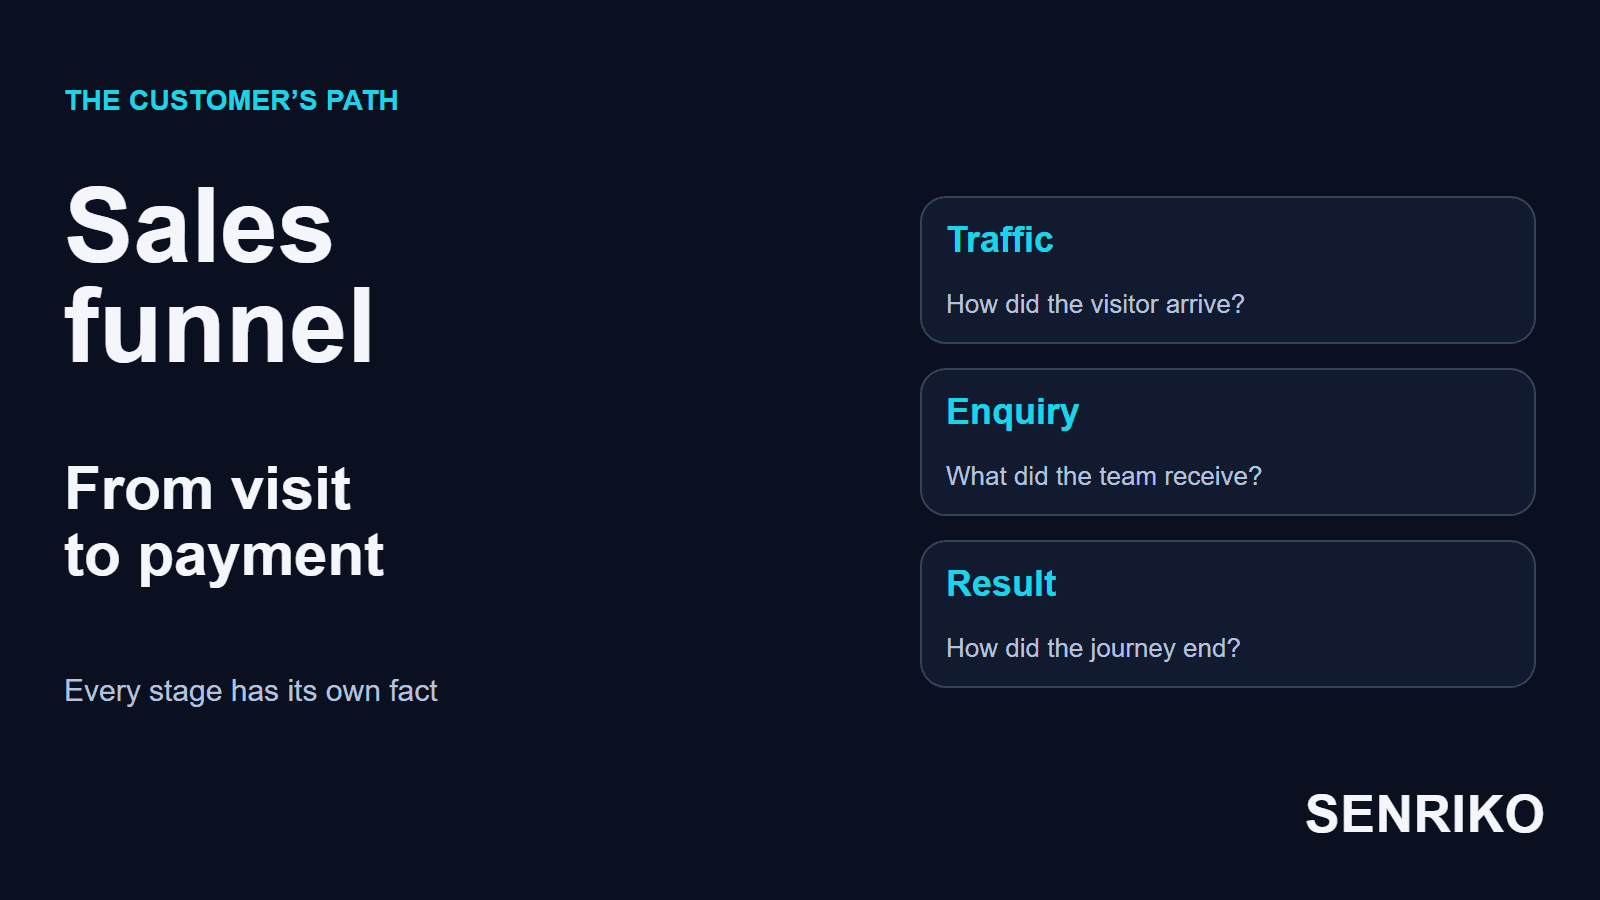
We start from the result and from the source of data for every stage: what the visitor did, what the team received, how the deal ended. That gives every disputed transition a check of its own.
What is a sales funnel on a website?
A sales funnel on a website shows how a visitor moves from first interest to an enquiry and a purchase. At each stage you record an action or a state of the customer: looked at the offer, sent a request, got a reply, agreed the terms, paid.
The AIDA model describes the move from attention to interest, desire and action. To work with data you have to turn it into events that can be checked. Interest in a service shows up as a look at the price or a request for a quote, for example, and the end of a deal is shown by an order status and a payment confirmation.
One person can take several routes. Some go straight to a service page; others read an article and come back a week later. A store may take an order on the site or by phone. Start with the common path and describe the other entrances separately, so that the diagram matches how the business works.
A click on a button, a submitted form, a created CRM record and a paid deal are different facts. If you fold them into one “conversion” number, it becomes hard to tell on which transition the result changed. Give each fact its own criterion.

Which stages should a sales funnel include?
Choose the stages by what the customer does and what the team does. For a store the cart and the checkout matter; for a service the content of the request, the qualification and the agreement matter more. The final stage has to match the result you bring visitors for.
| Stretch | Online store | Service site |
|---|---|---|
| Learning | Product page, terms of purchase | Service, prices, terms of work |
| Intent | Product in the cart, checkout started | Quote requested, a confirmed conversation |
| Handover to the team | Order accepted by the handler | Enquiry created in the CRM |
| Work of the team | Stock and terms checked | Qualification, proposal, contract |
| Money | Confirmed payment | Paid deal |
Do not turn an optional step into a condition of the whole diagram. If a buyer may order as a guest, registration is not a required stage before payment. If a client can reach you by a form, a call or a messenger, those actions can lead into one business stage, “Enquiry”.
For every step write down three things: the event or status, the unit you count and the source. The site’s analytics records a view; the handler’s log and the CRM confirm an accepted request; the payment or accounting system confirms the money. Name one person who answers for the correctness of that data.
In Google’s funnel exploration a step is a condition on events or dimension values, and the page says you cannot define a funnel step on a metric. Yandex Metrica’s Funnels report takes steps from page views, goals, event parameters, e-commerce events, calls and CRM order statuses. Whatever the tool, write the conditions by your own definitions. For an “Order” button, define the event that confirms the chosen stage, such as an enquiry accepted by the server, and test that it fires with a test submission.
How do you calculate funnel conversion?
The overall conversion of a funnel is the share of those who reached the last stage out of those who reached the first. The step conversion is the share who reached the next stage out of those who reached the previous one. For both, agree the units, the order of steps and the period of observation.
Overall conversion = result of the last step / result of the first step × 100%.
Step conversion = result of the current step / result of the previous step × 100%.
Say that 100 of 1,000 visitors made an enquiry, 60 were qualified and 20 paid. The step conversions are 10% into an enquiry, 60% from enquiry to qualification and about 33% from qualification to payment. The overall share of payments is 2%.
If the previous step has no observations, the next step’s conversion cannot be calculated: the denominator is zero.
Sessions and users give different bases. One person can visit a site several times and submit a request once. Transitions inside a visit are convenient to count by sessions. For a long deal, link the enquiries of one group of customers to their later result.
Also check the entrance and the order of steps. In Google’s documentation an open funnel lets users enter at any step and a closed funnel requires them to enter at the first, and a step can follow the previous one directly or with other actions in between. These settings change which users are counted, so record them with the calculation, and the next comparison will use the same rules.

Case: an online store, from cart to placed order
In an online store of household appliances in Bishkek, our team compared the checkout across devices. The original analysis covered 30 days, and about 68% of the traffic came from mobile devices.
| Step | Sessions | From the previous step |
|---|---|---|
| All sessions | 48,200 | the first step |
| Product page viewed | 21,700 | 45% |
| Added to the cart | 2,170 | 10% |
| Checkout started | 1,300 | 60% |
| Order placed | 520 | 40% |
The overall conversion of this funnel to a placed order was 520 / 48,200 × 100% ≈ 1.08%. That is a share of sessions with a checkout; for a share of payments you need a separate confirmed step.
CaseAnonymous caseOnline store of household appliances, Bishkek
The checkout on mobile
- What we saw
- The comparison by device showed a gap: on desktop 58% of those who started the checkout reached an order, on mobile only 29%. Mobile brought about 68% of the traffic. A local phone number did not fit the mask of the phone field, and the share of invalid phone numbers stood at 12%. Compulsory registration and delivery terms that the buyer learnt of too late were two more obstacles.
- What was done
- The team made four changes: the phone mask took the country codes +996, +7 and +998, a guest order was added, the delivery calculation was shown in the cart, and the form was cut from 14 fields to 7. The work took about two weeks.
- What came of it
- Four weeks after the changes were compared with the four weeks before them. Traffic varied within ±3%.
- 40% to 53%of checkouts started ended in an order
- 29% to 47%the same on mobile
- 520 to 690orders placed a month, approximately
- 12% to 1%the share of invalid phone numbers
The comparison covers the whole set of fixes, so the share of each fix cannot be separated here. In the table the final step is a placed order. Payments are added to it from the confirmations of the payment or accounting system.
Baymard’s benchmark of checkout flows counted 11.3 form fields on an average checkout in 2024 and says that most sites need only 8. This shop had 14 and went down to 7. Its list of reasons for abandoned carts, from a survey of US online shoppers, includes “the site required account creation” at 18% and “the checkout was too long or complicated” at 17%. That is Baymard’s data, not this shop’s, and it is a reason to look at those two things in your own checkout, not a forecast.
The table shows that the larger relative drop was between the product page and the cart. Yet the checkout held specific obstacles that could be fixed, and the users had already shown an intention to buy. We recommend choosing the stretch to work on by a cause you can check and by its closeness to the result, together with the size of the loss.
Case: dental clinics, from an article to an enquiry
At a chain of three dental clinics, the readers of the blog rarely reached an enquiry. The final result in this analysis was an attended appointment; no data on payments was supplied. The team compared entering through a service page with entering through an article. Over three months of analysis the average monthly values looked like this:
| Entry | Sessions | Enquiries | Attended appointments |
|---|---|---|---|
| Service page | 18,600 | 577 | 294 |
| Blog article | 43,400 | 52 | 24 |
CaseAnonymous caseA chain of three dental clinics, organic search
From a blog article to an enquiry and an appointment
- What we saw
- The step from the blog to the services was 1.4%. The articles gave 70% of the organic sessions and about 8% of the enquiries.
- What was done
- The team sorted the materials by the reader’s intent. The articles got a block on when it is worth contacting the clinic and a card for the matching service with a starting price and a WhatsApp button. Links to the 12 main services were added from the articles, and on mobile a booking button was pinned. Clicks on WhatsApp were checked against real conversations in WhatsApp Business, to count enquiries.
- What came of it
- In the 42 days after the change there were about 60,800 sessions entering through the blog, 189 enquiries and 84 attended appointments. We waited another 14 days after the period, so that late visits from the enquiries of those six weeks were counted. To compare with the earlier base the result was converted to 30 days: 189 × 30 / 42 = 135 enquiries and 84 × 30 / 42 = 60 appointments. Those monthly equivalents were compared with the averages of 52 enquiries and 24 appointments over the three months before. Blog traffic stayed comparable: 60,800 × 30 / 42 gives about 43,400 sessions a month, as before.
- 1.4% to 3.9%the step from the blog to the services
- 52 to 135enquiries a month, the monthly equivalent of 42 days
- 24 to 60attended appointments a month, the same conversion
For traffic like this, measure the path from an article to a confirmed enquiry and then to the actual visit, and keep the average conversion rate of the site for the overall picture. Recording a visit does not confirm a payment, and the comparison set the monthly equivalent of 42 days against an average month of the three before, not the same six weeks.
How do you tie the site, the CRM and the payment together?
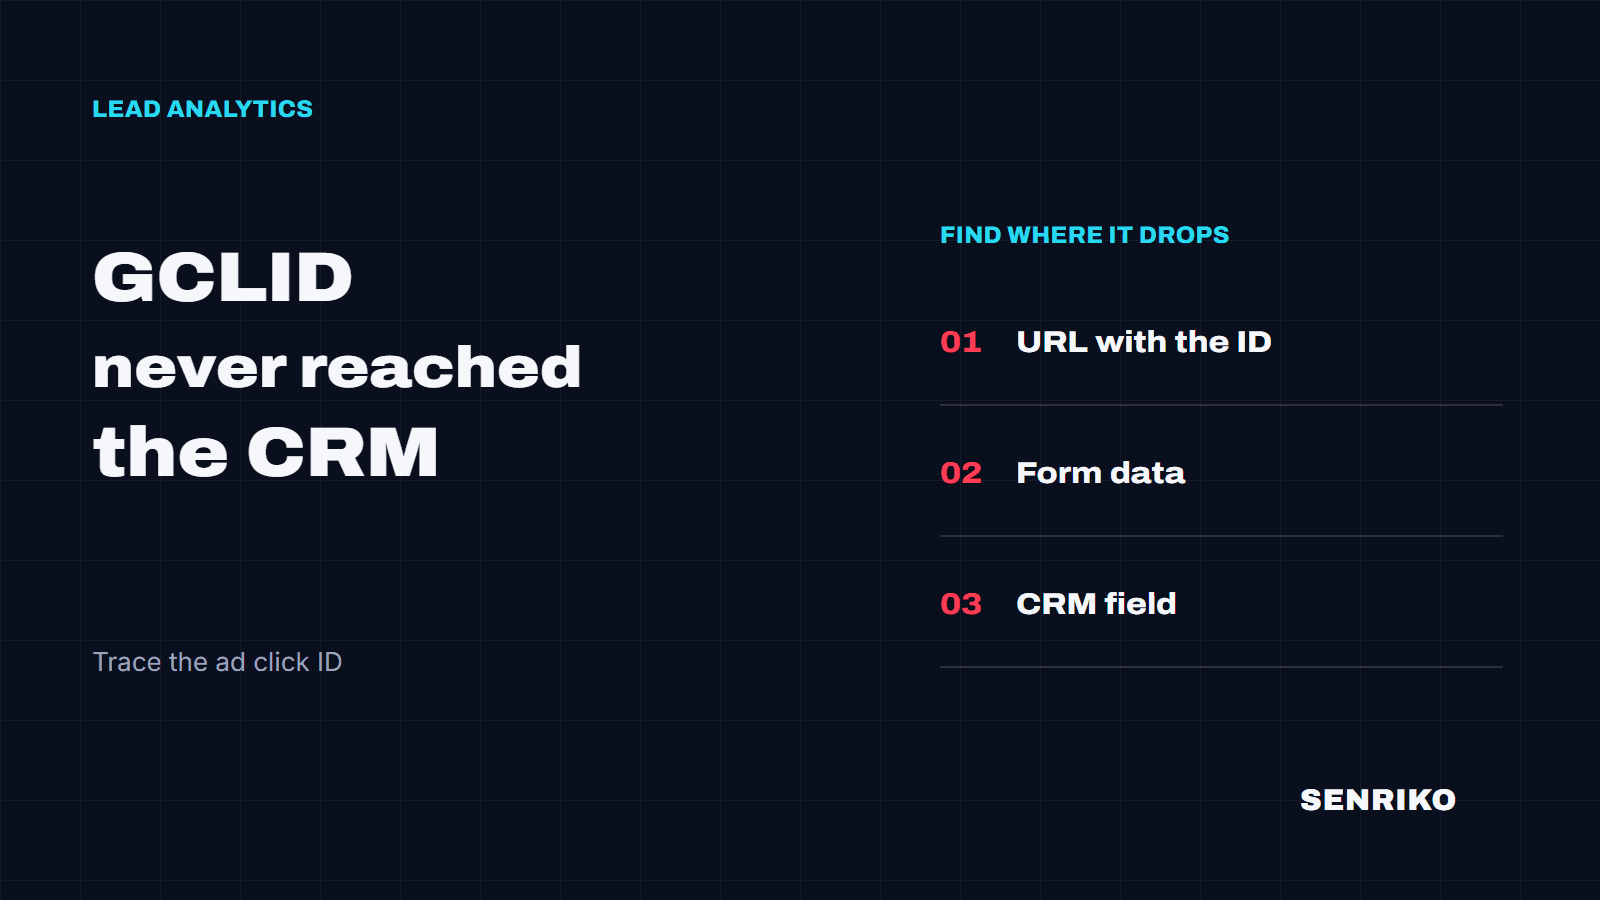
The stages are tied together through the identifiers of the enquiry or the order and through agreed statuses. An analytics event describes an action on the site; the CRM shows what the team received and did; the confirmation of payment comes from the money records.
Check the transitions in this order:
- Fix the unit and the period: a session, a person, an enquiry or an order. For a long deal, define the group by the period it was acquired in and the date on which you judge its result.
- Match an accepted enquiry to its CRM record by ID. Check that the source is kept and how duplicates are handled.
- Set the same definitions of qualified and of closed. A lead at the “New” stage is not yet an accepted proposal or a payment.
- Reconcile purchase events with orders and payments. Account for cancellations, refunds and test submissions by a rule agreed in advance.
- Walk the disputed transition yourself: the form, the success message, the record in the system and the expected event should agree with each other.
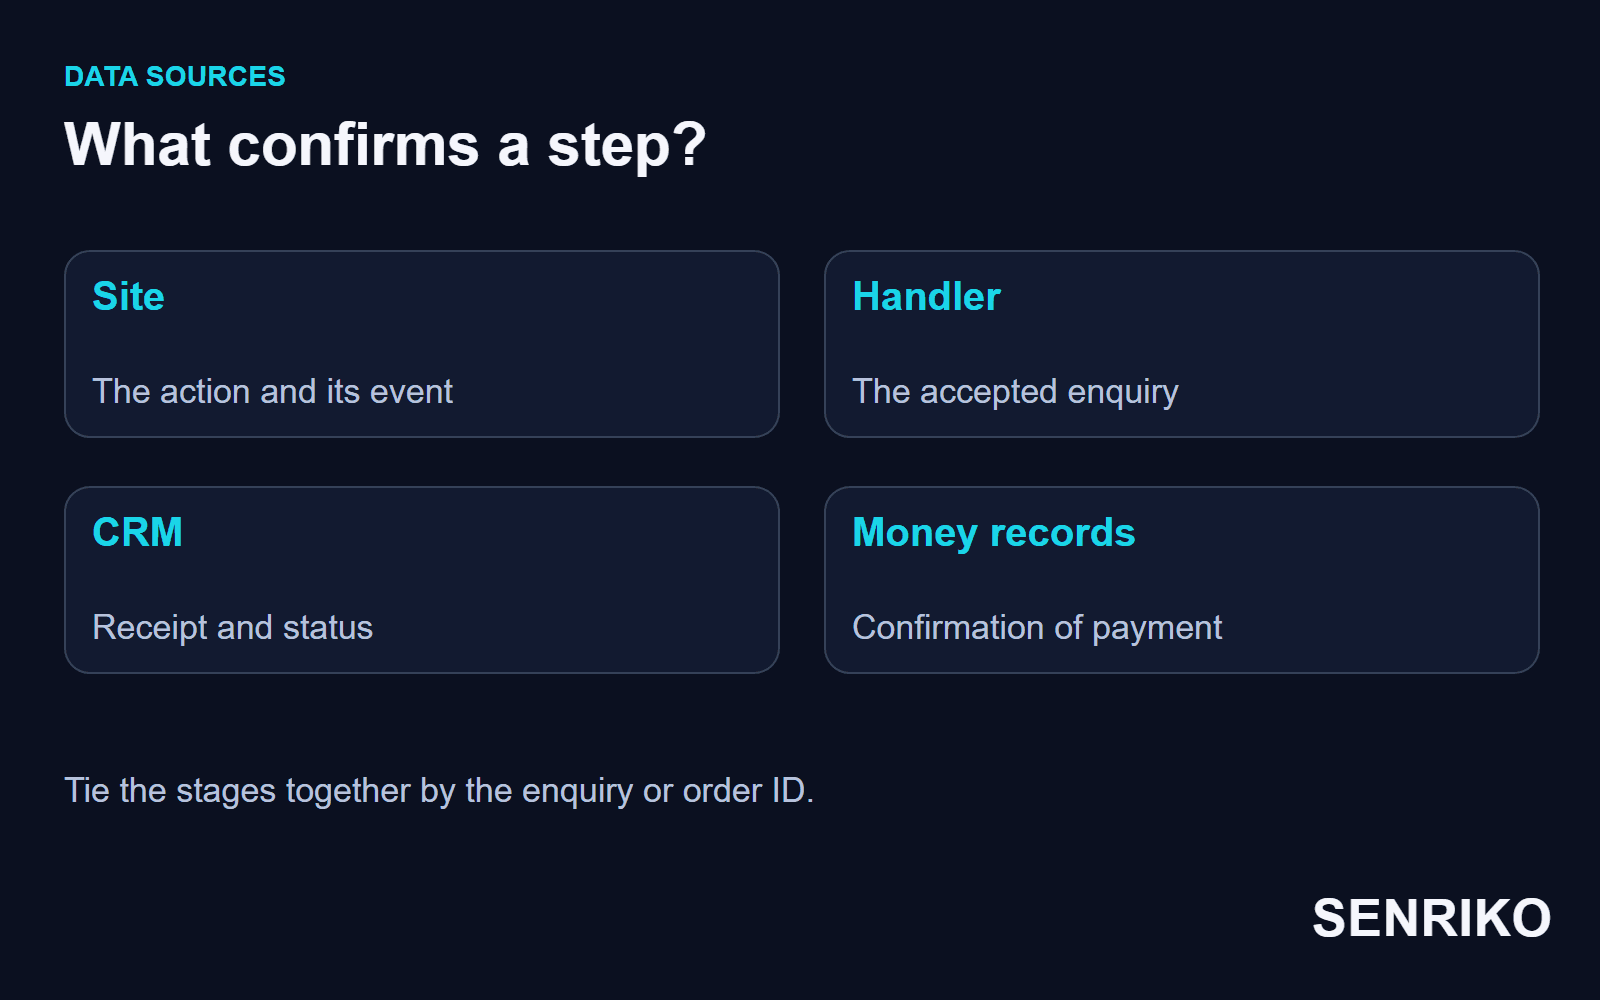
When submissions and real enquiries disagree, carry on the diagnosis along the delivery path. For that use the guide to a low conversion rate and the results of checks on the form in question.
In SENRIKO we check that the form works and that the expected conversion signal follows. Delivery of a test lead to the CRM is confirmed by a receipt from the CRM’s rule, and the whole business path to payment is put together in analytics and in the money records. Pick the disputed transition and set the evidence of both sides against each other.
Where do you start building and checking a funnel?
Start from the result the business needs and work back to the data of each step. Then check the transition where you found a specific error or where two sources disagree.
In a store, check the checkout from a phone and with a local phone number. On a service site, set the entry pages against the confirmed enquiries. If the deal is long, first make sure the sales belong to the chosen group of acquired customers. The ground for the choice should be written down next to the number.
Keep the definitions of the stages, the units, the observation windows and the starting period. After a change, compare the result by the same rules. If several fixes went in at once, judge them as one set and plan a separate test for the disputed hypotheses.
Add your form to SENRIKO. Start with the form through which most of your enquiries arrive, confirm the site and set the expected result. That way a technical failure on the chosen transition can be found before the next review of the report.
Frequently asked questions about sales funnels
What is a sales funnel?
Which stages does a sales funnel have?
How do you calculate funnel conversion?
What is the difference between an open and a closed funnel in GA4?
Is a placed order the same as a sale?
What is a good funnel conversion rate?
Sources
- Explorations: Funnel explorationAnalytics Help, Google
- Funnels reportYandex Metrica Help
- Average number of form fields in a checkout flowBaymard Institute
- Cart abandonment rate statisticsBaymard Institute
- Pricing and levels of checksSENRIKO
- Delivery to the CRM, the receiptSENRIKO