Contents
- What is A/B testing?
- Hypothesis and metrics: what do you compare?
- How do you plan the sample and the duration?
- Case: delivery time under the price
- Case: a form, more enquiries and the result of qualification
- How do you check the variants before launch?
- How do you read the result and make the decision?
- Frequently asked questions about A/B testing
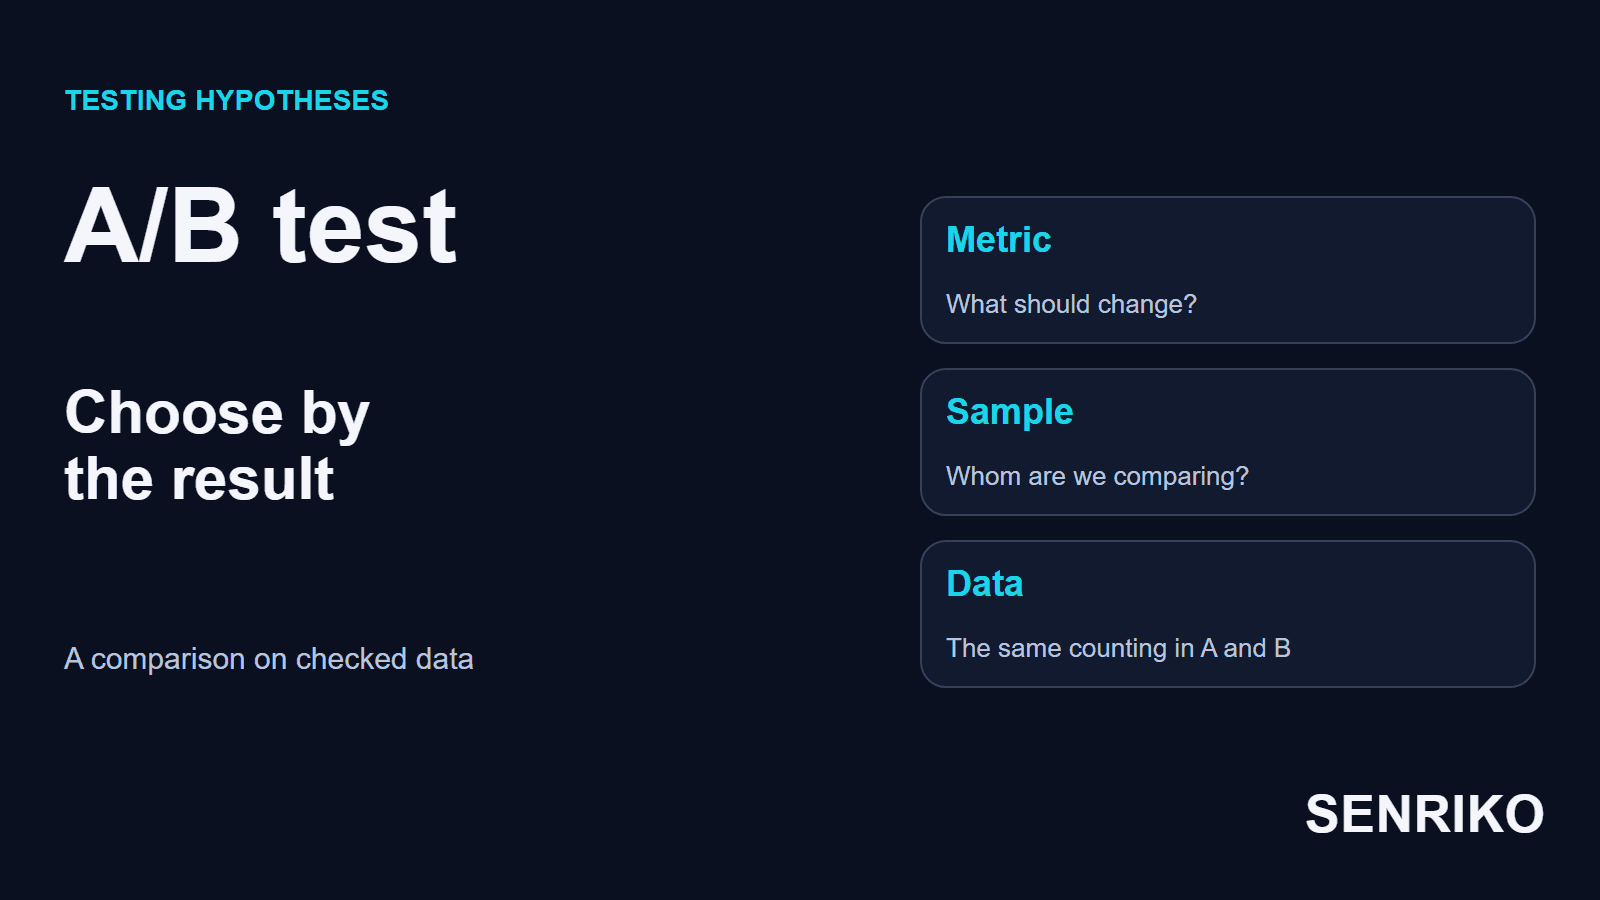
An A/B test compares variants by a result chosen in advance. The metric has to match the business goal, and both groups have to be counted the same way. In two cases from our team’s earlier practice, the decision depended on placed orders and on how enquiries were qualified.
What is A/B testing?
In A/B testing, also called split testing, two versions of a page are shown at the same time to randomly assigned groups. Group A sees the current version, and group B gets the change under test. When the test ends you compare the result you chose in advance.
An ordinary comparison of figures before and after a release judges the change together with everything else that happened in the period. Groups that run at the same time help to separate the effect of the version under test from a general change in demand. The quality of the assignment and of the measurement still has to be checked.
Google describes an A/B test as a randomized experiment with two or more variants of the same page, and says that to run one in GA4 you integrate a third-party A/B testing tool, while the results are analysed in GA4. The split can be done by a tool such as Varioqub, Yandex’s experiment tool, or by your own site’s logic. SENRIKO helps to check that forms and signals work; running the experiment and computing its statistics belong to separate tools.

Hypothesis and metrics: what do you compare?
A hypothesis has to tie a change on the page to a specific result. For example: showing the delivery time and cost under the price will raise the share of product-page users who place an order. That wording shows what changes and what to measure.
Before the launch, write down the decision criterion and the figures by which you will notice possible harm:
- The primary metric on which you will decide: a placed order, a paid purchase or a qualified enquiry.
- Secondary figures that help you to understand behaviour: adding to the cart, opening the form, all submissions.
- Guardrail metrics: the average order value, cancellations, the load on processing and other possible consequences of the change.
For a binary conversion, fix who counts as a participant and which achievement counts once per person. The ratio of qualified enquiries to all visitors answers the question of how many useful enquiries come out. The share of qualified ones among the submitted forms describes the quality of the flow you already got. These denominators give different numbers.
Keep an experiment card: the hypothesis, the versions, the unit of assignment, the primary metric, the sample plan and the stop rule. For a late result, state the waiting period separately. Put in the card the dates of the start and the stop, the changes to the site during the test and the reasons data was excluded. With that record the next analyst can reproduce the calculation and tell a new finding from a change of rules.
If we had to choose one primary metric for the form of a B2B service, we would choose a confirmed qualified enquiry from a visitor. A plain submission shows in the report sooner, but it can raise the workload without a rise in the useful result. The qualification criterion must stay the same for both groups.
How do you plan the sample and the duration?
The sample size is calculated before the launch from the baseline conversion, the minimum effect and the statistical approach you accept. The duration comes from the traffic of the very page under test and from the time the final result needs.
In the store case, after the checkout had been fixed, the baseline conversion from a product page to an order was 4.2% by users. The team chose a minimum effect of +18% relative to the control, a significance level of 0.05 and power of 80%. A plan like that needs about 12,000 users per variant.
About 570 unique users a day looked at the product pages, which is about 285 for each version. So the plan came to 42 days, six full weeks. For a plan like this take the traffic of the product pages: those are the users who take part in the experiment.
The minimum detectable effect sets the sensitivity of the plan. Power describes the probability of finding the chosen effect under the assumptions made. The significance level limits the risk of a false discovery for the chosen test. The values 0.05 and 80% belong to this particular plan, and the duration is set by its sample and traffic.
Results need time as well. The qualification of enquiries depends on the managers’ work, and cancellations show up late. Write down the observation period in advance. In an experiment with a fixed horizon, stopping at the first lucky p-value changes the conditions of the test. Evan Miller’s write-up shows that every extra look at the data raises the false-positive rate, and that committing to a sample size in advance is what removes the problem. Sequential analysis is possible if its method is chosen and set up before the launch.
Case: delivery time under the price
The team moved the information about delivery from a separate tab to under the price of the product. In the new version the time and the cost depended on the buyer’s city and on availability. The primary metric was the conversion of product-page users into a placed order; the average order value and cancellations were checked as guardrails.
| Version | Users | Orders | Conversion |
|---|---|---|---|
| A: delivery in a tab | 11,960 | 502 | 4.20% |
| B: delivery under the price | 12,040 | 597 | 4.96% |
CaseAnonymous caseOnline store of household appliances
Delivery time and cost under the price
- How it was run
- The split ran through Varioqub and the experiment lasted 42 days. The group sizes were close to the planned 50/50. The pinning of the variant and its passing to the data have to be checked apart from the size of the groups.
- What came of it
- The gain is about 0.76 percentage points, or 18% relative to A. The difference in points is 4.96 − 4.20, and the relative gain is 4.96 / 4.20 − 1. For comparing two binary shares, an independent recalculation by a two-sided z-test gives p of about 0.005.
- What was decided
- The team found no significant change in the average order value or the share of cancellations, and rolled out B. It left the observations by individual segments as hypotheses for later tests: many comparisons raise the chance of a chance finding.
- 4.20% to 4.96%conversion of product-page users into an order
- about 18%relative gain, 0.76 percentage points
- p about 0.005a two-sided z-test of two shares, recalculated
The 4.2% base belongs to the period after the checkout had been reworked, and to users. The store’s original funnel used sessions. A person can look at a product page in several visits and place an order in one; such figures should be compared only after the units and the period have been agreed.
Case: a form, more enquiries and the result of qualification
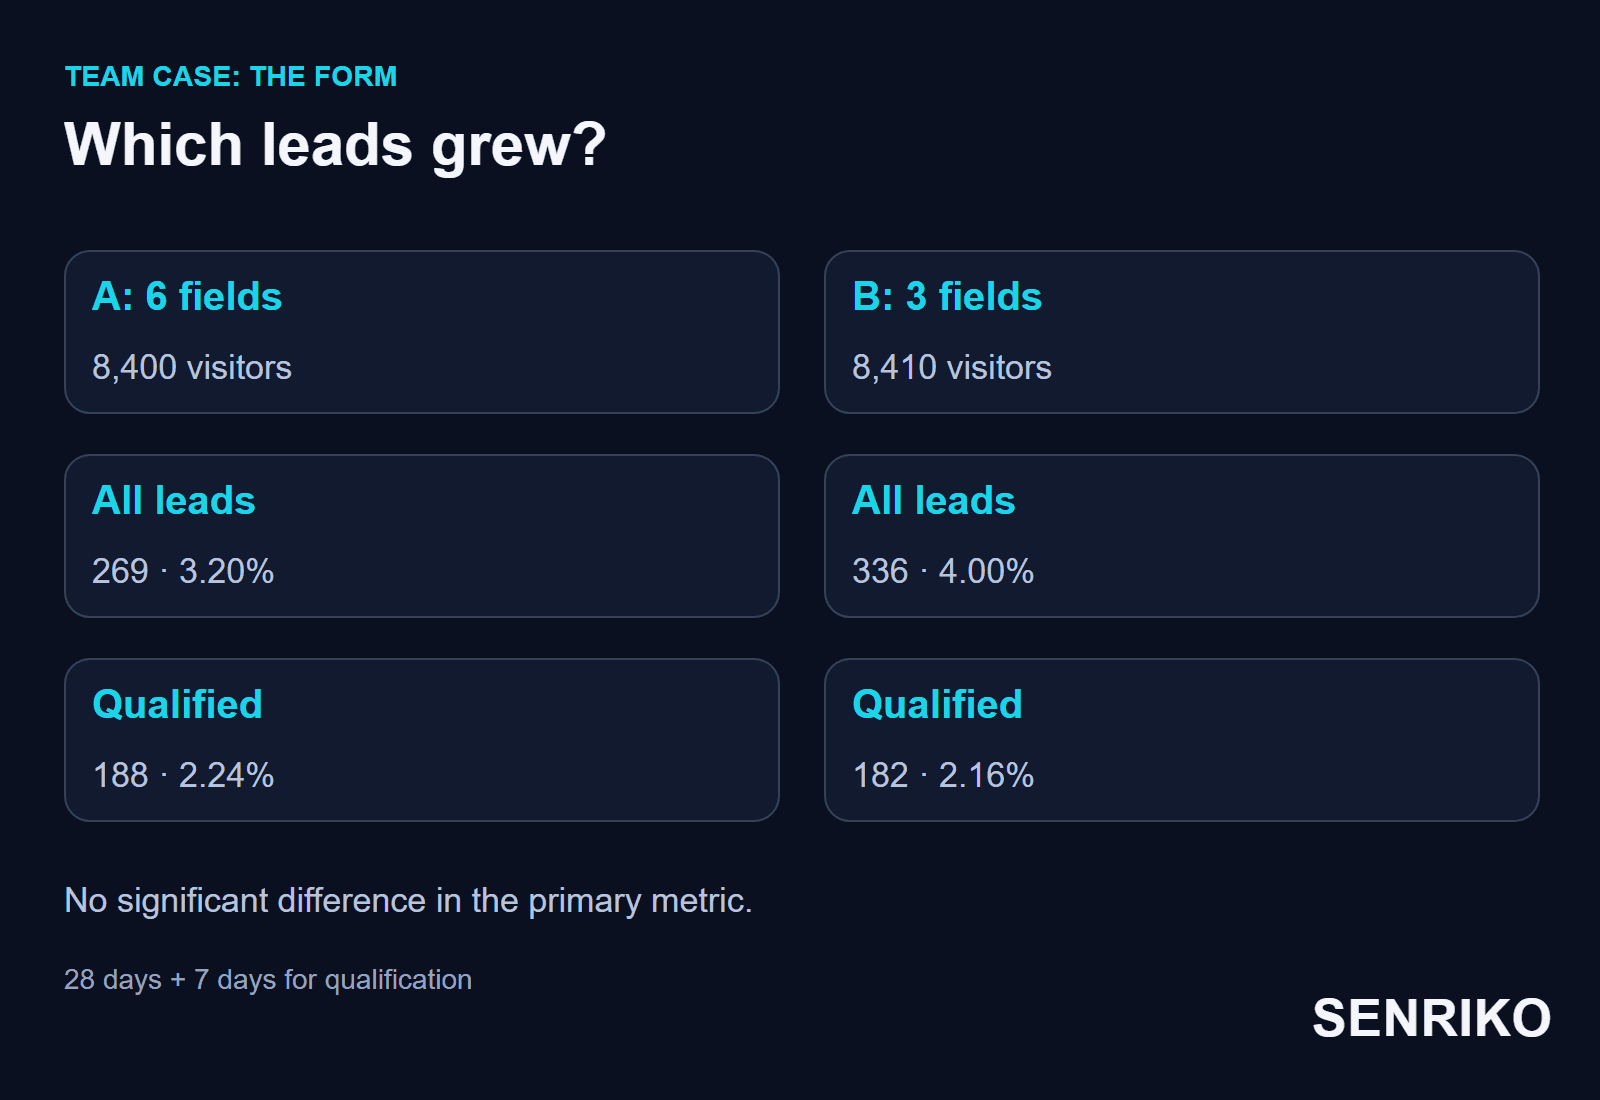
In an accounting-services project for sole proprietors and limited companies (IP and TOO), a short form increased the number of enquiries, but no significant difference was found in the output of qualified leads. The primary metric was defined by the “Proposal sent” stage in amoCRM and counted from the visitors of the page.
Version A kept six fields: name, phone, form of ownership, tax system, number of employees and a comment. Version B had only name, phone and a choice between IP and TOO. The assignment was done on the backend by a cookie, and the variant’s name went to the CRM in a hidden field.
| Metric | A | B |
|---|---|---|
| Visitors | 8,400 | 8,410 |
| All leads | 269 (3.20%) | 336 (4.00%) |
| Qualified | 188 (2.24%) | 182 (2.16%) |
CaseAnonymous caseAccounting services for sole proprietors and limited companies
A short form: more leads, the same qualification
- How it was run
- The experiment ran for 28 days. After it ended we waited another seven days for the managers to qualify the last enquiries. Full weeks covered the difference between weekdays and weekends, and the extra waiting let the leads of both groups be assessed the same way.
- What came of it
- For all leads the relative gain in the share was about 25%. Recalculating the two shares gives p of about 0.006. For qualified leads the observed difference is negative, about −3% relative to A, and not statistically significant. The approximate 95% confidence interval for the difference of the shares runs from −0.52 to +0.37 percentage points.
- What was decided
- The managers reported that the short enquiries took more time: the details had to be found out by phone. That is the team’s observation, with no numerical measurement of time. The original form was kept, and a two-step variant was planned as the next hypothesis. It has to be judged in a separate experiment.
- 3.20% to 4.00%all leads from visitors, p about 0.006
- 2.24% to 2.16%qualified leads, the difference is not significant
- −0.52 to +0.37 pointsthe approximate 95% interval for the difference of qualified shares
That interval shows the range of effects compatible with the data under the chosen calculation. A small worsening or a small improvement both remain possible. The conclusion “no significant difference was found” keeps that uncertainty; a claim that the variants are fully equal would be stronger than the result of the test. Yandex’s own page on Varioqub reports reads it the same way: a result that is not significant shows only that the effect is smaller than the minimum detectable one.
How do you check the variants before launch?
In both versions, perform the target action and check that it is counted the same way. A faulty event, a lost hidden field or a variant that changes when the user returns can alter the report even if people behaved the same.
- Open both versions on the main devices and in the main browsers. Check the form, the availability of the buttons and the passage through the new part of the page.
- Trace the form’s request and the server’s response. Match the test enquiry to a CRM record, if the CRM is used in the metric.
- Check the analytics event, the identifier and the variant that was passed. Remove repeats and exclude test enquiries by one rule.
- Check the permitted states of the cookie banner: the conditions of counting must match the consent settings in both versions.
- Assess the distribution of participants and how firmly the variant is pinned. If the shares diverge unexpectedly, look for the cause in the data and in the assignment mechanism first.
Microsoft Research’s article on sample ratio mismatch defines it as a statistically significant difference between the ratio of users counted in the variants and the ratio configured before the experiment. It says to detect it with a statistical test such as chi-square, before reading the effect, and not to trust the results of a test with a mismatch until you have diagnosed the root cause. About 6% of A/B tests at Microsoft had one. Check the group sizes together with their make-up, the pinning of the variant and the completeness of the events.
The GA4 Checker shows the GA4 streams and the requests sent on a single page load: it clicks nothing, submits no form and does not answer the cookie banner. The states of the banner are compared by the Cookie Consent Checker: it opens the page before any choice, after Accept All and after Reject All.
Check a real form submission in monitoring after the site is confirmed, and the delivery of a test lead to the CRM is confirmed by a receipt from the CRM’s rule. Go through both versions and compare the expected stages of the result.

How do you read the result and make the decision?
First check that the data is fit to use, then the size of the effect and its uncertainty. After that set the primary metric against the guardrails and the cost of rolling out or of processing.
Record the decision against these questions:
- Were the planned sample and the observation period reached? Were both groups counted the same way?
- How did the primary metric change, in percentage points and relative to the control?
- What does the interval of uncertainty allow, and does the effect fit the business goal?
- What happened to the guardrails and to the team’s work?
- Roll out the variant, keep the current one, or formulate the next hypothesis?
Statistical significance does not measure the value of a change in money. In the form case, for example, the rise in submissions was significant, but the primary metric gave no ground to roll out the shorter form. And the p-value is not the probability that the hypothesis is true: it is a figure for the chosen statistical test.
The shares in the cases were recalculated as independent binary results at a fixed horizon, with a two-sided z-test for proportions. Platforms may use other methods: Varioqub’s report, for instance, uses the Mann-Whitney U test with bucketing and a default alpha of 0.05. Compare results from one method and with the same definitions.
Add your form to SENRIKO after the rollout. We check the chosen action and the expected signal, so that a new technical failure can be told apart from a change in the experiment’s results. Start with a form you have already confirmed, and keep its expected behaviour after the release.
Frequently asked questions about A/B testing
What is A/B testing?
How long should an A/B test run?
How do you calculate the sample size?
What does “no significant difference” mean?
Can you stop a test as soon as it looks significant?
Why check the split between the groups?
Sources
- [GA4] A/B testing in Google AnalyticsAnalytics Help, Google
- Diagnosing sample ratio mismatch in A/B testingMicrosoft Research
- How Not To Run an A/B TestEvan Miller
- statsmodels.stats.proportion.proportions_zteststatsmodels
- Varioqub: experiment reportsYandex
- GA4 CheckerSENRIKO
- Delivery to the CRM, the receiptSENRIKO