Contents
- Low conversion rate: what to compare first
- Where do visits, events, leads and money drift apart?
- Case study: steady leads, falling sales
- Case study: analytics and the payment provider disagree after a release
- How do you check the path from visit to lead or payment?
- What to fix once you have found the gap
- Frequently asked questions
When the conversion rate is low, start by pinning down which action you counted as the result. A form submission, a lead that fits, a purchase event and a payment that actually cleared all sit at different stages of the funnel. When their numbers drift apart, you can find the leak without rushing to redesign the page.
Low conversion rate: what to compare first
Name the action you divide by. Your lead conversion rate is the share of visits that ended in a submitted form. The share of qualified leads tells you how many of those enquiries suit the business. A purchase in analytics and money in the bank are two further, separate checks.
If the drop shows up only in a report, take two comparable periods. Check the numerator first: one report may count a button click, another a successful submission. Then compare visits. A new channel, a promotion or a different share of weekend traffic all change what you are comparing.
Split the data at least by source, landing page and device. The overall rate can stay flat while desktop gains cover a fall on mobile. If conversions dipped right after you widened your campaigns, check whether the audience changed. If traffic and sources held steady and leads vanished on one device after a release, test the form on that device.
Look at absolute numbers first
With the same conversion rate, fewer visits still mean fewer leads. In that case the cause is in your traffic: a falling conversion rate is only worth investigating while traffic is stable.
Where do visits, events, leads and money drift apart?
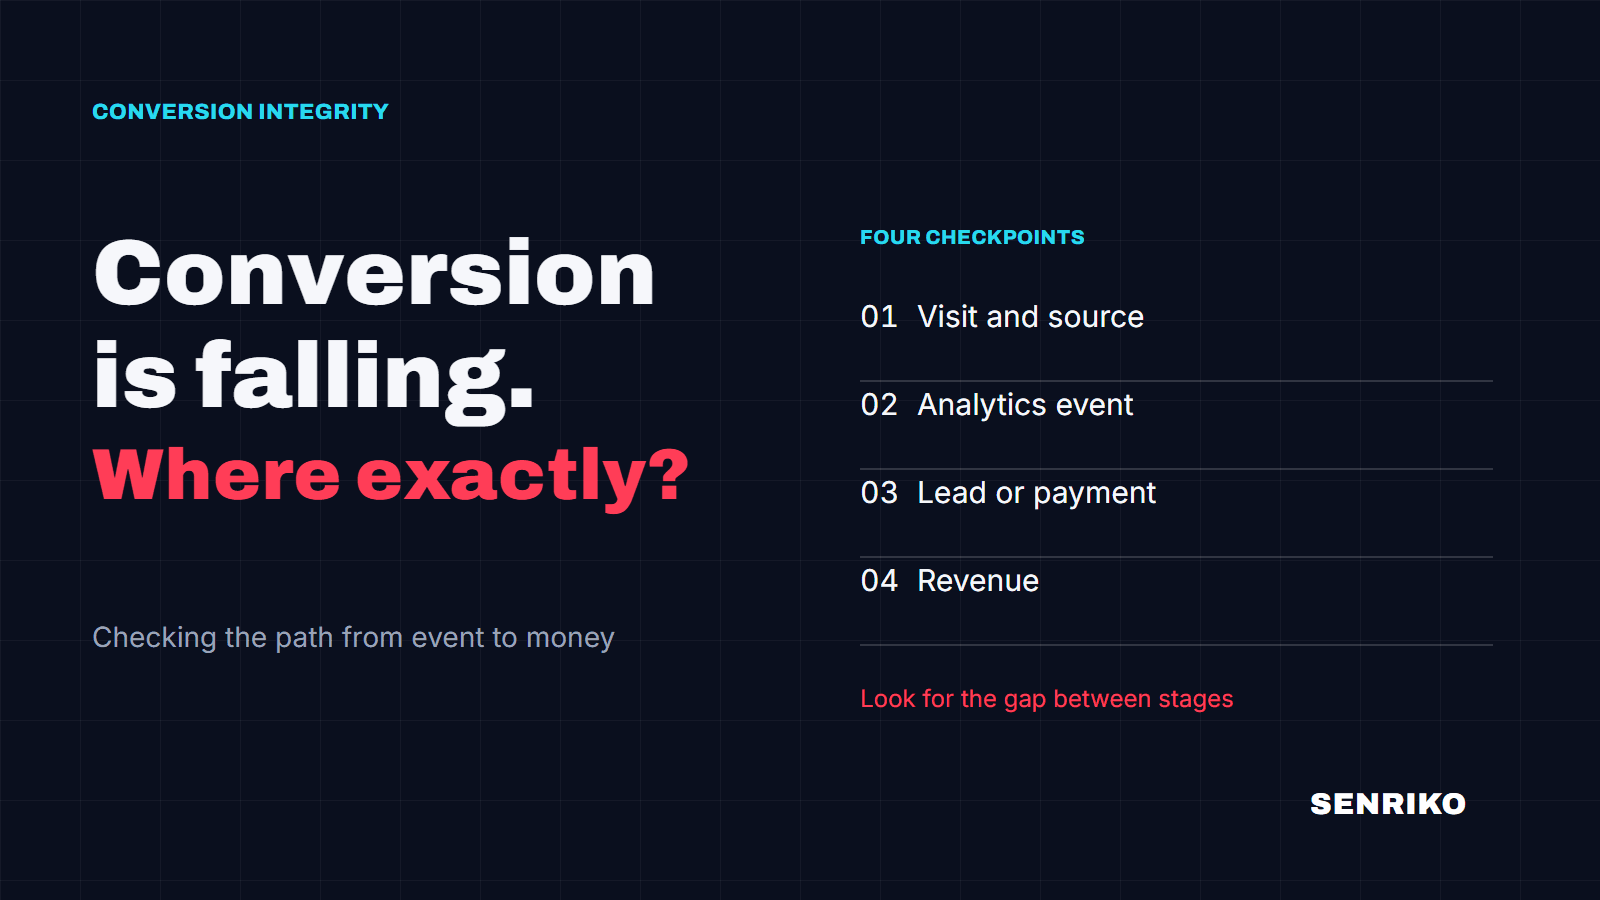
Line up four numbers for the same period: relevant visits, goal events in analytics, leads actually received or payments confirmed, and closed sales. Instead of a vague “conversions are down”, you will see between which two neighbouring stages the numbers split. Compare like with like, and leave your sales team time to work the leads before you judge revenue.
- Visitssource and device
- Eventsform or purchase
- FactsCRM or payment provider
- Moneydeals and revenue
| What you see | What to check next |
|---|---|
| Fewer visits, same share of leads | Traffic sources, budgets, whether landing pages load |
| Fewer submit events, but enquiries still reach the CRM | The goal setup, analytics consent, duplicate or missing events |
| Same number of events, fewer enquiries in the CRM | Form delivery, email, the CRM integration, the server log |
| Same number of leads, fewer qualified ones | Sources, search terms, qualification criteria, the bidding goal |
| More “purchases” in analytics than successful charges | The event trigger, gateway statuses, retries, the return from checkout |
Each row points to the next place to look: a CRM record, the form log, an analytics event or a payment status. Clicks on a phone number, add to basket and form opens help you find the barrier. In a report on paid orders, count successful payments separately from those in-between actions.
Case study: steady leads, falling sales
CaseAnonymised caseB2B · equipment and engineering services
The same number of form submissions, 45% fewer qualified leads
- What the reports showed
- From 1 to 21 October 2025, analytics and the ad accounts showed 142 form submissions against 138 in a comparable earlier period. The site converted at about 2.1%. A report like that is easy to read as business as usual.
- What sales saw
- Qualified leads fell by 45%. The share of CRM records marked “rejected” or “not a fit” rose from the usual 15% to 58%, and revenue nearly halved.
- What we found
- Shortly before the numbers diverged, the automated bidding strategy had been switched to optimise for form submissions. Around the same time, the required company name field and the budget question were removed from the form.
- 142 vs 138form submissions, period on period
- −45%qualified leads
- 15% → 58%rejected leads in the CRM
We matched CRM statuses against sources and UTM tags, checked the form logs for duplicates and spam, then went back through changes to the campaigns and the page over the previous weeks. The new enquiries included more people without the budget, and private customers looking for home repairs rather than industrial equipment.
The algorithm received a “form submitted” signal and went looking for more people likely to submit. The goal it optimised for said nothing about lead quality. Google’s own best practices for lead generation recommend optimising for a goal such as a qualified or converted lead, and feeding later stages back through enhanced conversions for leads.
A steady 2.1% hid a worse mix of leads.
With a long sales cycle, some fresh enquiries will not have reached payment yet, so judge short-term revenue with that lag in mind. A rise in rejected leads shows up sooner. Check it by campaign and search term, then decide which fields you need for qualification and which goal to pass to your ads.
Case study: analytics and the payment provider disagree after a release
CaseAnonymised caseOnline sales · short purchase cycle
Analytics showed 10% fewer purchases, the money showed 32% less
- What the reports showed
- The basket and the payment gateway were updated. Between 12 and 22 May 2026 traffic held at about 45,000 sessions. Add to basket rose by 8%, and checkout starts did not change. The top of the funnel looked healthy.
- What we found
- On some smaller iPhone screens the mobile layout covered the 3D Secure confirmation window. Buyers got as far as entering the code, could not finish and left. In some unfinished sessions, a script on the return from the payment page also told analytics that a purchase had started, so the report showed a smaller drop than the money did.
- What was decided
- Restore payment on the affected devices, and tie the purchase event to a confirmed, successful payment.
- +8%add to basket
- −10%purchases in analytics
- −32%money received
We broke the funnel down by device, browser and operating system, then went through the gateway logs and session recordings at the payment step. If a gap like this opens after a release, pay on the affected device and screen size yourself. For the final number, match each unique order with its gateway status and the money received. Once it is fixed, repeat exactly that path: bank sign-in, the confirmation code, the return to the site and a successful charge.
Testing 3D Secure without a real card
If you take payments through Stripe, its test card that requires 3D Secure on every transaction walks you through the bank step on any screen, with no real money involved.
How do you check the path from visit to lead or payment?
Follow the path from a relevant visitor to a CRM record or a successful charge. Note when the numbers first diverged: that time makes it much easier to line the data up with releases, form changes and new ad goals.
Write down four control numbers
For the chosen page and matching periods, note visits, submit or purchase events, CRM records or successful payments, and closed qualified deals. Write the data source next to each number. With a long sales cycle, allow for the lag from lead to revenue.
Split the gap into segments
Compare mobile with desktop, then browsers, operating systems, channels, campaigns and landing pages. If one device and browser combination fell after an update, try to reproduce it. If the campaign mix changed, look at the quality of the incoming traffic.
Go through it yourself
Send a safe test enquiry and follow it from the confirmation on screen to the CRM. For a purchase, use the test payment flow your project provides and check the status in the gateway. A button click and a thank-you page only show part of the path.
Check the event against the fact
GA4 DebugView shows the event during a test. Make sure it fires on the right outcome and does not repeat when the visitor tries again. The form, CRM and payment logs show what happened after the browser. Our free GA4 checker shows which GA4 streams a page sends to.
Check what changed before the first gap
In your release history, look for changes to the form, the basket, consent, tags and payment steps. In the ad account, look for a new optimisation goal or a change in the traffic mix. For each hypothesis, write down the observation that would confirm or rule it out.
SENRIKO submits forms in a real browser and watches the conversion signals it can see; how many checks run depends on the plan. Lead quality in the CRM and successful payments are still yours to match against your own systems.
What to fix once you have found the gap
Fix the stage where the break is confirmed, and judge the result by a metric close to the sale. If the event disappeared while leads still arrive, restore the tracking and check it with a test submission. If the form does not deliver enquiries, fix the hand-off to the CRM. If payment fails on some phones, remove that specific barrier in the mobile flow and repeat the payment test.
Test the advice to cut your form down
In a simple flow, extra fields really do stop people submitting. In a complex B2B sale, the company name, region or budget range can be what separates an enquiry for industrial equipment from a request for home repairs. Removing those questions raises submissions and the load on your sales team at the same time, and a bidding strategy that learns only from those submissions gets a signal with no measure of quality.
Decide about fields with two numbers: how many people complete the form, and what share of those enquiries become qualified. Compare both before and after the change. Where a long questionnaire genuinely puts off the right customer, move some questions to a later step and keep the quality signal for your ads and your sales team.
After the fix, repeat the check on the affected segment. Keep watching the form and the conversion signal: at the next release you will see whether a person reached the action, and what the CRM or the payment system confirmed.
Frequently asked questions
What counts as a low conversion rate?
Why do form submissions hold steady while sales fall?
Why does analytics count more purchases than my payment provider?
Will a shorter form raise my conversion rate?
Sources
- Best practices for generating high-quality leadsGoogle Ads Help
- [GA4] Monitor events in DebugViewGoogle Analytics Help
- Test card requiring 3D Secure authentication for every transactionStripe Support
- Conversion tracking checkerSENRIKO
- Plans and what each includesSENRIKO