Contents
- What does 500 Internal Server Error mean?
- A 500 error on your site: where do you start?
- Case: a nightly XML feed tied up the web processes
- Case: an updated plugin blocked the cart
- How do you choose a fix from a log entry?
- How do you verify that the page and the order have recovered?
- How does a 500 error affect search?
- Frequently asked questions about 500 errors
To find the cause, save the failed request and match it with the application’s log. In two of our cases that led to different problems: a heavy XML feed started through the web server, and an updated plugin that blocked cart requests.
What does 500 Internal Server Error mean?
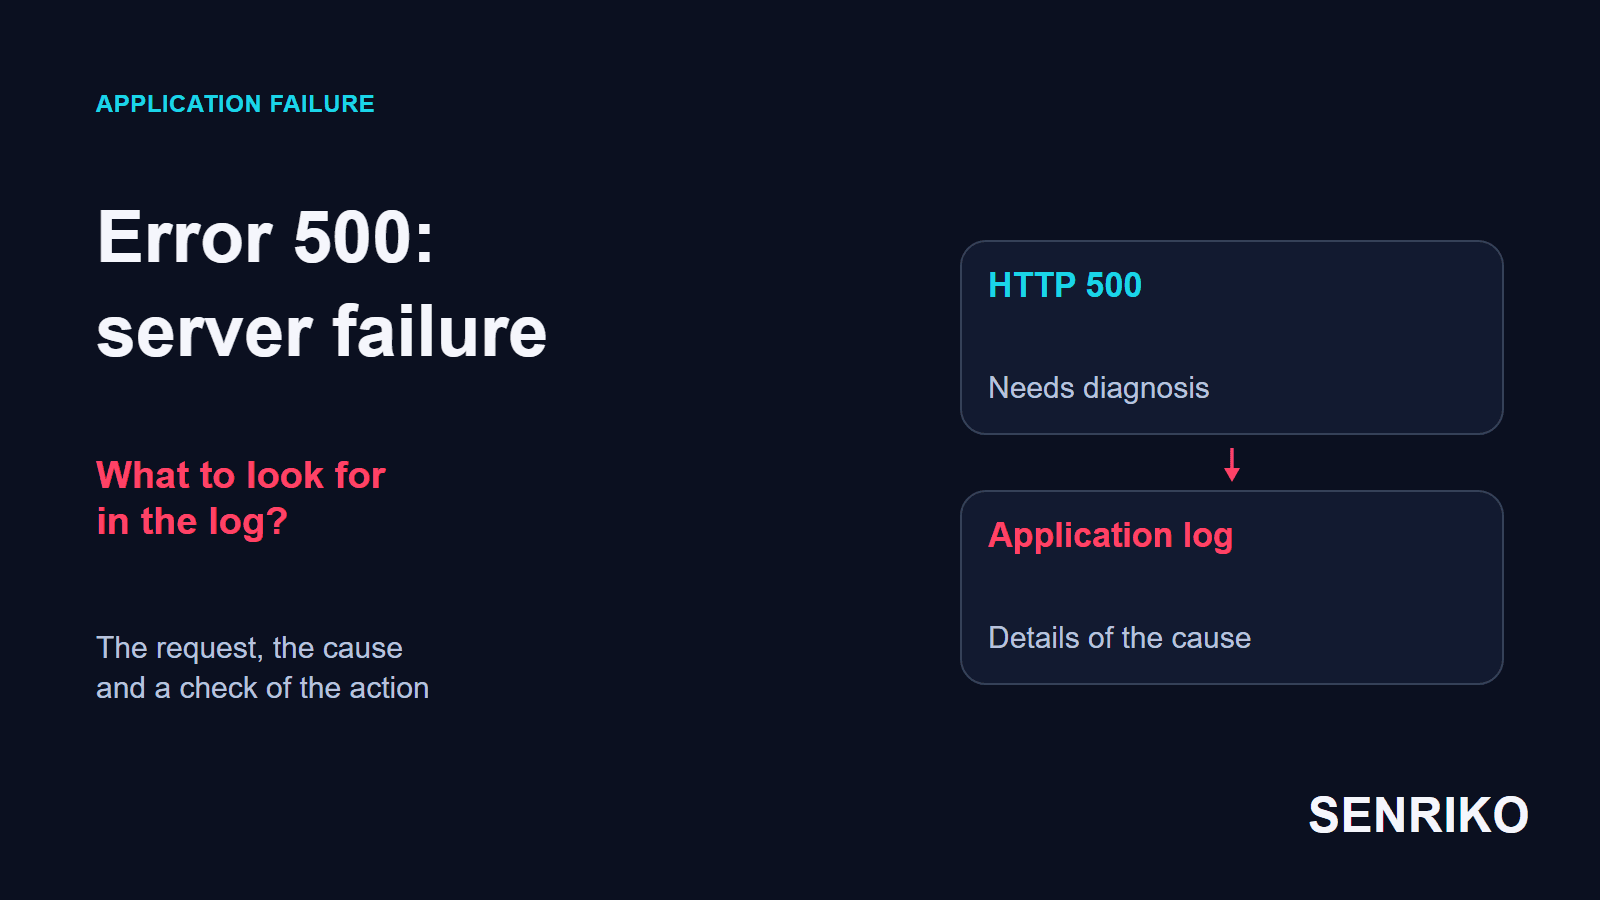
500 Internal Server Error means an internal failure while the server handled a request. It is a catch-all code: it alone does not tell you whether memory ran out, the application crashed or a configuration is wrong. MDN describes it the same way and lists improper server configuration, out-of-memory issues, unhandled exceptions and improper file permissions among the possible causes.
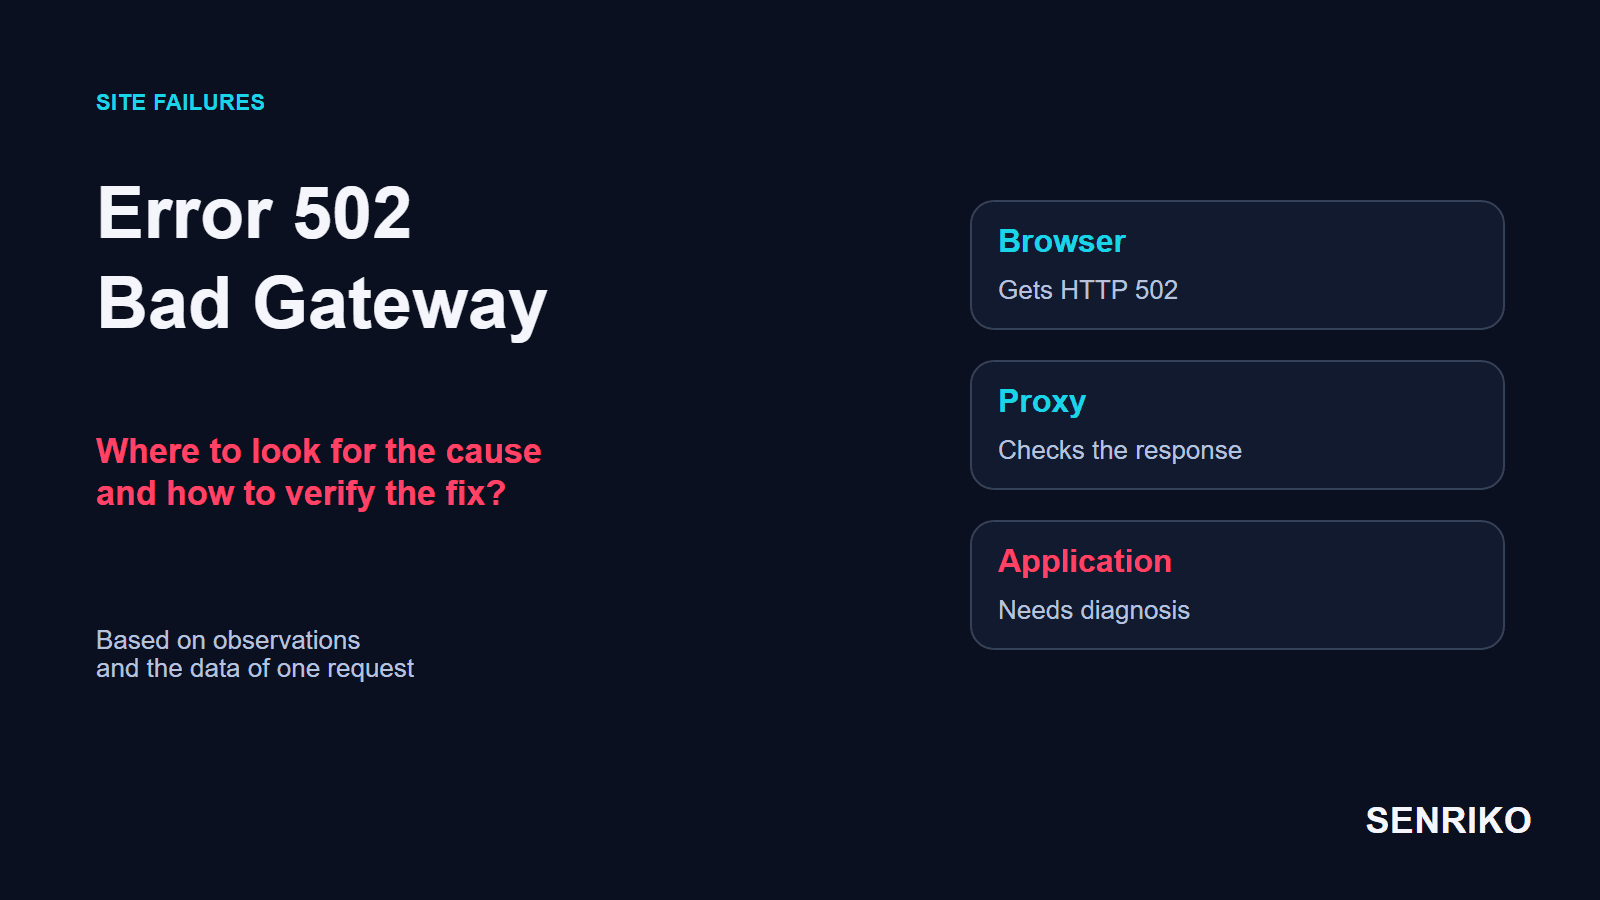
Compare the actual responses. With a 500 the request ended in an internal error; with a 502 Bad Gateway a gateway or proxy got an invalid response from the next server; a 504 is about waiting for a response through a gateway. One fault in the application can come with different codes at different points of the chain.
If you are a visitor, you can open an ordinary page again and give support the address and the time of the failure. After an error at payment, check the state of the order and the payment first. Repeating the same action can create a duplicate if the server managed to carry it out before the failed response. For requests with such effects, the HTTP standard says a client should not retry automatically unless it knows the request is safe to repeat.
A 500 error on your site: where do you start?
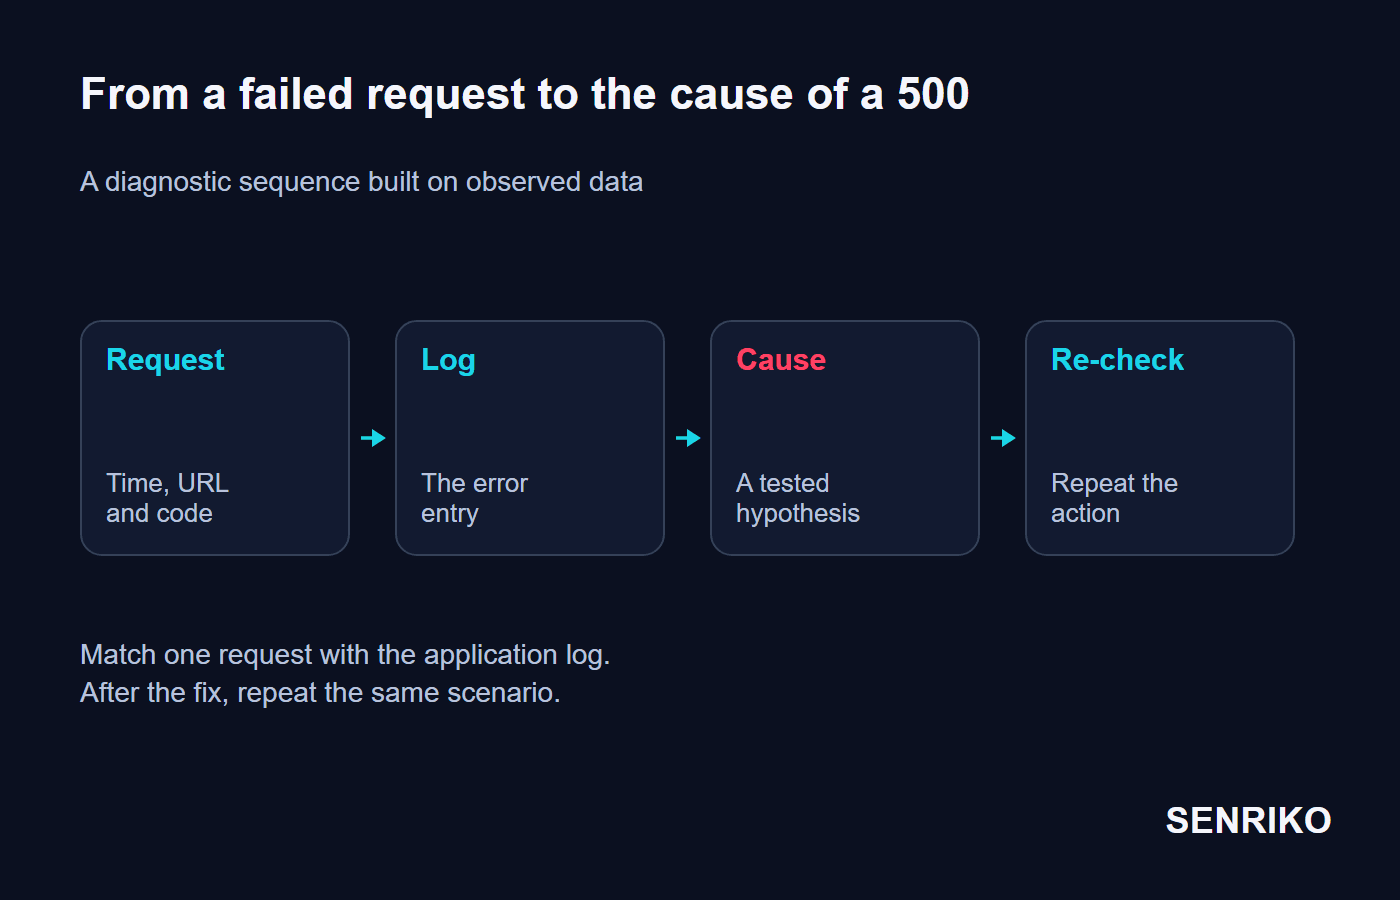
Save the failed request and find its entry in the logs. The time and the address tie the visitor’s observation to the exception in the application or the state of the server, and from that you can choose a fix.
Work out what is affected
The whole site, one page, sign-in, the cart or a form. Repeat the action the visitors reported.
Open the Network tab in developer tools
Save the URL, the request method, the status and the time of the error. A white screen alone does not confirm a 500.
Check the web server and application logs for the same moment
On hosting, support can help with this; on your own server, the administrator can.
Look at recent changes
A release, a plugin update, the PHP version, database settings and scheduled jobs. A failure that recurs at the same time is especially useful for checking cron.
Nginx, PHP-FPM and the application can each have their own logs. Nginx’s often lives in /var/log/nginx/error.log, but the exact location is set by the configuration, and that is where you check where PHP writes its errors. Match an entry to the right domain and request, especially when a server hosts several sites.
On WordPress, debug mode helps keep the details of a failure. WordPress’s documentation separates WP_DEBUG, WP_DEBUG_LOG and WP_DEBUG_DISPLAY, and advises against the debug tools on live sites. If you have to use them on a production site, write errors to a log only an administrator can read and keep them off the page the visitor sees. Return to normal operation after the check.
If the cause is not yet known, give the developer a short set of data: the URL and the action, the exact time, whether it repeats, the error entry and the changes before the first failure. That lets them reproduce the problem and test their hypothesis.
Case: a nightly XML feed tied up the web processes
A shop’s feed generator ran through the shared PHP-FPM web pool. It gathered a large catalogue in memory and loaded the database, and ordinary visitor requests waited longer to be served.
CaseAnonymous caseOnline shop with 50,000 products
Nightly failures while the feed was generated
- What we saw
- Every night around 03:00 the team saw failures lasting from 15 to 20 minutes. The feed generation logs held the message
PHP Fatal error: Allowed memory size of 268435456 bytes exhausted. - What we found
- The job processed about 50,000 products. Checking the cron schedule, the team saw a call to
generate-feed.phpthrough wget or curl: generation ran as an HTTP request through Nginx and PHP-FPM. So a long job occupied a process of the same pool as the ordinary visitors. The script ran heavy JOIN queries against MySQL and accumulated the catalogue in memory. The database began to answer more slowly, and ordinary web requests held the workers for longer. As requests piled up, the PHP-FPM pool reachedpm.max_children, the setting that limits the number of requests the pool serves at once. - What was done
- Finding the cause took about an hour, and the refactoring about three. The script was rewritten to read 500 products at a time and write the XML as a stream. The run was moved to the CLI (
/usr/bin/php /path/to/script.php) so that the job no longer occupied a PHP-FPM web process.
- 15 to 20 minuteseach nightly failure lasted
- 256Mmemory_limit the generator exhausted
- 500 productsread at a time after the rewrite
At the same time the generator ran into its own memory_limit: 256M, that is 268,435,456 bytes. In the incident we observed there were 500 errors; with an unavailable or slow upstream, other requests could end in 502 or 504. A console script ending on its memory limit would not by itself explain the failure of the other pages. Here there was a shared web pool and a load on the database.
Reading in batches and running separately changed how the shared resources were spent. For the script itself the memory_limit was raised to 512M for a time. PHP describes memory_limit as the maximum memory a script may allocate, so before raising it, weigh what the process in question can actually have.
The team saw no drop in SEO on this project, but some of the night’s ad traffic landed on the failures. A night schedule does not rule out visits by search crawlers either. Check a fix during the job’s next run, not only on a working homepage in the morning.
Case: an updated plugin blocked the cart
After the WordPress plugins were updated, cart and checkout requests began to stall in the database. This case was a partial failure: the problem showed in the action an order needs.
CaseAnonymous caseWordPress and WooCommerce
The cart returned a white screen after a plugin update
- What we saw
- After the WordPress and WooCommerce plugins were updated, the cart and checkout returned a white screen with a 500 status.
- What we found
- We turned on
WP_DEBUGand matched the errors with MySQL queries.SHOW PROCESSLISTshowed hundreds of waiting queries with the statusLocked. One marketing plugin was lockingwp_optionswhile it initialised the user session. - What was done
- The problem plugin was disabled over SSH by renaming its folder. The administrator restarted MySQL, and then the team brought back the plugin’s previous version from a backup and passed a description to the module’s developers.
- about 25 minutesthe cart was unavailable
- hundredsof queries with the status Locked
Here it is right to speak of waiting for a lock. The Locked status does not prove a deadlock: that conclusion needs more information. For example, MySQL recommends SHOW ENGINE INNODB STATUS to examine the latest deadlock InnoDB detected.
After such an update, repeat adding a product and checking out: those actions test the changed module. In this project rolling it back restored the path of an order. Restarting MySQL was part of the administrator’s actions in this incident; choosing it takes a separate diagnosis of the database.
How do you choose a fix from a log entry?
A log entry helps you choose the first move. The table collects common signals and checks; after the change, repeat the request on which you found the error.
| Signal | What to check | First action |
|---|---|---|
memory_limit exhausted | The volume of data and how an array builds up in the script | Reduce memory use; weigh the limit of that particular process |
| An error after a plugin update | The module’s version and the request where the exception arose | Check disabling or rolling back that module under your recovery plan |
A directive error in .htaccess | The Apache configuration and the file’s last change | Restore the correct rule and check the request |
| A wait on the database, or a timeout | Locks, long queries, the connection | Look at how the database works and at the code that calls it |
.htaccess belongs to Apache, and its documentation explains how such files are processed. Plain Nginx has no per-directory configuration files and uses its own configuration, so changing .htaccess in that environment will not fix the problem.
First save the original entry and the working configuration, then change one confirmed part. Raising every timeout or the memory can postpone the failure and leave the heavy query or the plugin conflict where it was. If the symptoms match the latest release, check its rollback plan and make sure it keeps the data created after the release.
How do you verify that the page and the order have recovered?
Repeat the broken scenario and check its result. A homepage that returns 200 can sit beside a cart or form handler that does not work.
For a cart error, check adding a product, opening the cart and placing a test order. For a form, check sending it and the expected confirmation that it was received. If you need to be sure the enquiry reached the CRM, find the test record in the CRM itself: a successful submission in the browser and receipt in the CRM are checked separately.
Look at the request that used to return 500 and at the new log entries. Then repeat the check in the conditions of the earlier failure: during a cron run, on the same type of page or after the update of that specific module. Record the time and the result so that later checks can be compared with the recovered state.
Add the site to SENRIKO monitoring if the failure of an important action has to be noticed between releases and manual checks. We watch availability and check the forms you choose in a browser. When the homepage answers, a separate form check shows the state of its submission. To find the internal cause, a developer will still need the server and application logs.
The last step, delivery of the test lead to the CRM, is confirmed by a receipt from the CRM’s rule. In the rule that separates our test leads, add one more action: an email to the receipt address from the form check, or a call to its link. A receipt within an hour of the check confirms the step “The lead reached your CRM”.
If two checks in a row bring no receipt, it shows in the findings. A receipt speaks only of delivery, and SENRIKO does not connect to your CRM, so check the contents of the lead’s fields there. Set up control over exactly the stretch your enquiries travel.
How does a 500 error affect search?
Long and repeating 5xx errors keep a search crawler from getting your content. According to Google’s documentation, the crawl rate drops when it meets such responses, and URLs that keep returning a server error are eventually dropped from the index.
A short single failure does not mean pages leave search. To judge the effect, look at how long it lasted, how many URLs it touched and whether it repeated. After the fix, check the important addresses in Google Search Console, and in Bing Webmaster Tools if you use it, and then keep watching their responses.
Keep the history of your important pages’ responses together with the date of the fix. A repeated 5xx can then be matched with the earlier incident and the new change to the site.
Frequently asked questions about 500 errors
What is the difference between a 500 and a 502 or 504?
Can a plugin update cause a 500 error?
Should I restart MySQL when I see Locked queries?
Where is the error log?
Sources
- 500 Internal Server ErrorMDN Web Docs
- Description of core php.ini directives (memory_limit)PHP Manual
- FPM configuration (pm.max_children)PHP Manual
- Debugging in WordPressWordPress Developer Resources
- How to Minimize and Handle DeadlocksMySQL 8.4 Reference Manual
- Apache HTTP Server Tutorial: .htaccess filesApache HTTP Server documentation
- Converting Apache Rewrite Rules to NGINX Rewrite RulesNGINX Community Blog
- RFC 9110: HTTP Semantics, section 9.2.2 Idempotent MethodsIETF
- How HTTP status codes affect Google’s crawlersGoogle Search Central
- Pricing and levels of checksSENRIKO
- Delivery to the CRM, the receiptSENRIKO