Contents
We recommend starting from one concrete failed request: save its address, its time and what the user was doing, then find the related log entries. In our projects a 502 came both from a PHP-FPM pool tied up waiting and from a container that was killed during a large export. The two failures needed different fixes.
What does a 502 Bad Gateway error mean?
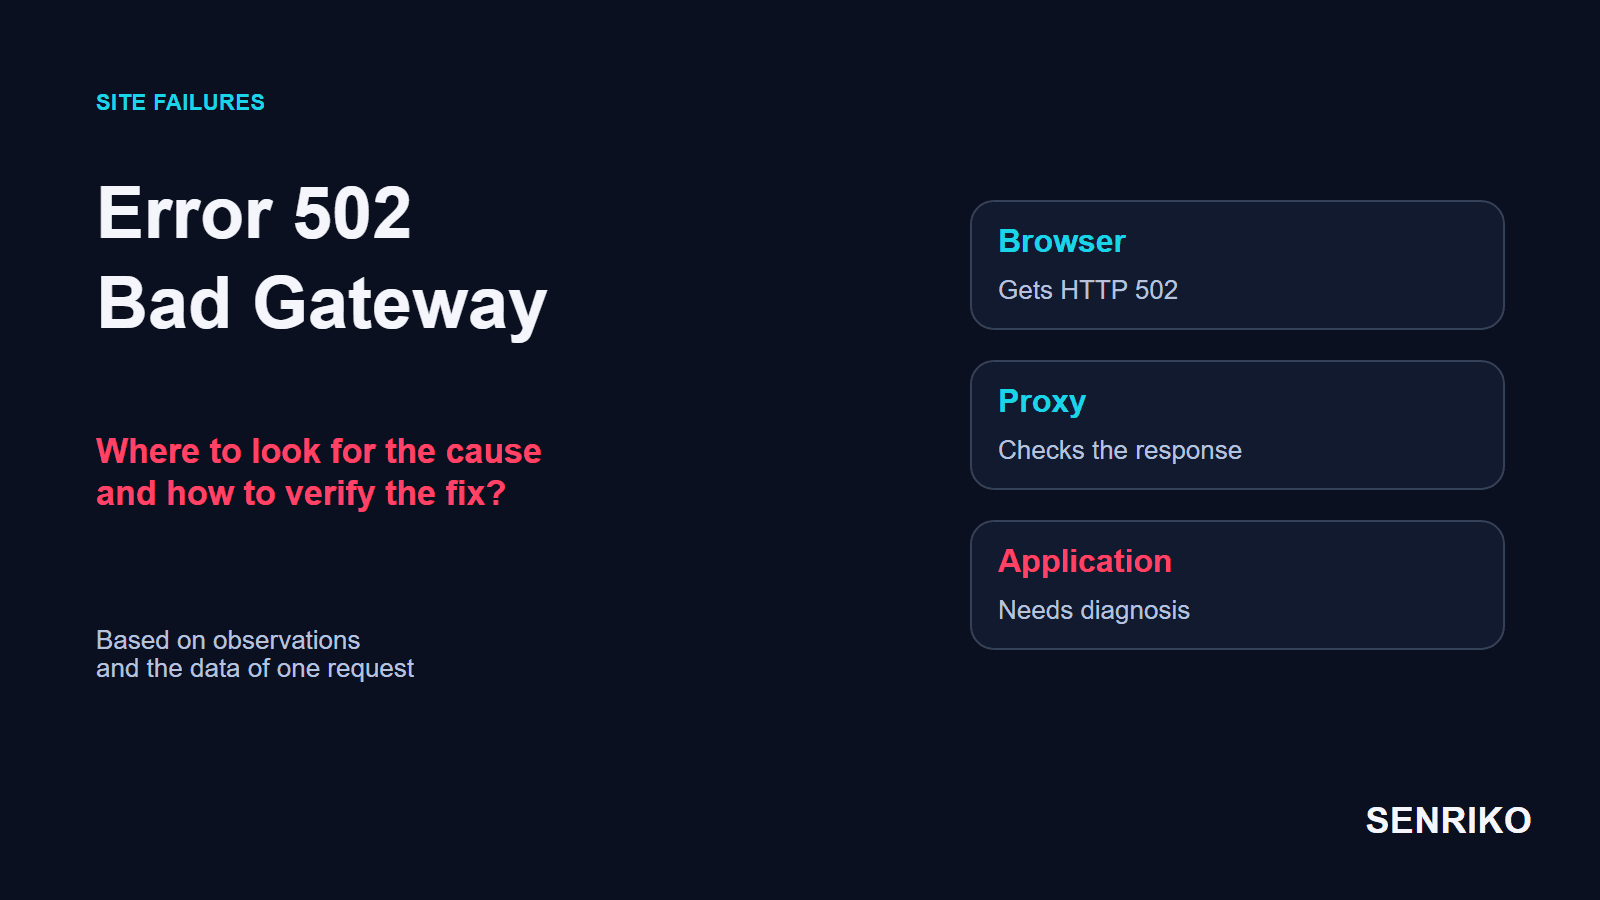
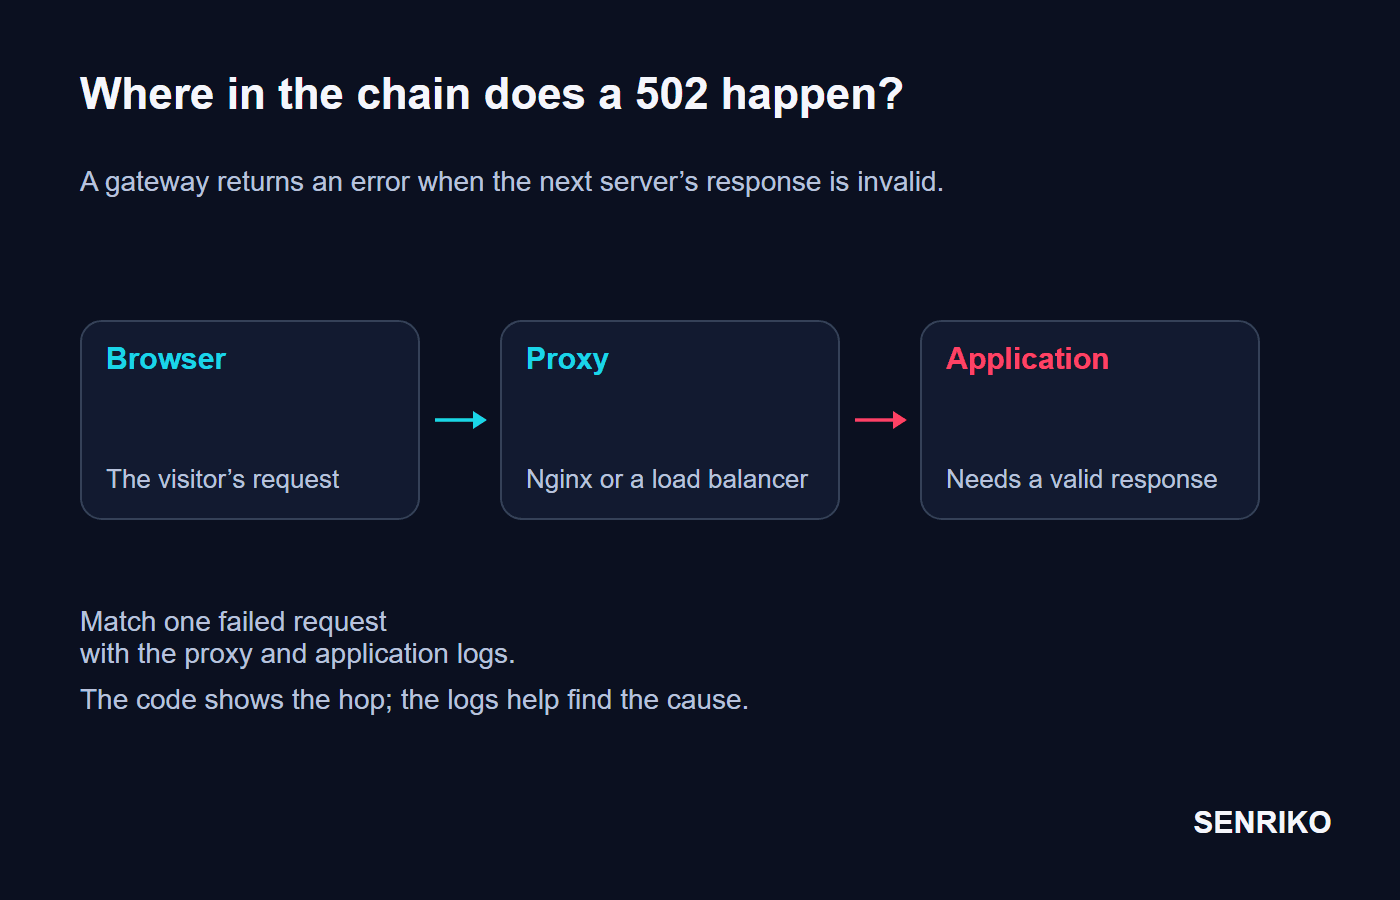
A 502 means a server acting as a gateway or proxy received an invalid response from the server behind it, the upstream server. Say Nginx accepted a visitor’s request, passed it to the application and could not return a usable result. That is what the HTTP status code says. It does not say why, and the cause is a separate question.
Several servers can sit behind one public address: a CDN, a load balancer, Nginx and the application. The words on the error page tell you who produced the page, not who is broken. A 502 Bad Gateway nginx page does not prove that Nginx is the faulty part: the application may have exited, stopped accepting connections or returned something the proxy could not handle. If the site is behind Cloudflare, its page on error 502 or 504 explains how to tell an error from your origin from one of Cloudflare’s own, and what support needs: the time with its time zone, the failing URL and the output of /cdn-cgi/trace.
| Code | What happened | Where to look first |
|---|---|---|
| 500 | The server met an internal error while handling the request | The application log and the request that caused the failure |
| 502 | A gateway received an invalid response from the next server | The link between the proxy and the application, and the application’s state |
| 503 | The service is temporarily not ready to handle the request | Overload, maintenance, whether the service in question is available |
| 504 | A gateway got no response from the next server in time | How long the work takes and the timeout at the relevant hop |
Similar causes sometimes produce different codes. A slow external API can tie up the application’s processes, after which new connections start to be refused. So both the HTTP status and the log entry for the same request matter. MDN draws the line between the two gateway codes: a 502 is a response that arrived and was invalid, a 504 is no response at all.
502 Bad Gateway on your site: what should you check first?
Before you restart anything, save the failed request and the logs that belong to it. Then work out where the handling breaks: before the connection to the application, or inside it. That one distinction narrows the list of possible fixes at once.
Reproduce the failure and record it
Open DevTools, the Network tab, and repeat the action. Find the main page request or the one the form sends, and note the HTTP status, the URL and the time. The error text drawn in the page does not replace the response status. From a terminal, curl prints the status and the total time of one request.
curl -sS -o /dev/null -w "%{http_code} %{time_total}s\n" https://example.com/catalogue/Compare several scenarios
Does the homepage open? Does the catalogue work? Does the failure appear only at checkout, at sign-in or when a large report is built? That can narrow the search to one handler.
Rule out your own device
If the error shows up on one device only, try another browser and another network. A local VPN or proxy can interfere with the connection. If it repeats for different visitors, move on to the server chain.
Find matching entries in the logs
Look at the Nginx error log and the application’s log for the same minute. On Debian and Ubuntu the Nginx log is usually
/var/log/nginx/error.log. For PHP-FPM, the pool log and the slow log help. For a containerised application, read the container’s state, its events and the reason for its last termination.sudo tail -n 100 /var/log/nginx/error.logMatch the first error to a change
Compare the time the errors began with a release, a migration, a socket setting, network rules or a newly connected integration. A matching time tells you where to look; reproducing the failure and reading the logs confirm the cause.
If the site runs on hosting where you cannot reach the server, give support the address, the exact time with its time zone, the action and the status you saw. “It sometimes doesn’t work” gives them very little to search for.

Case: PHP-FPM was waiting for a shipping API
Low CPU load does not show how many processes are waiting for an answer from outside.
CaseAnonymous caseOnline shop
Waves of 502s while the server looked idle
- What we saw
- In one online shop, Nginx returned 502 in waves after an ad campaign started, although CPU and memory stayed below 40%.
- What we found
- The Nginx error log showed failed connections to the PHP-FPM Unix socket:
Resource temporarily unavailable, error 11. That entry pointed at the hand-off of requests to the application. The next source confirmed the cause: inphp-fpm-slow.log, processes were stuck incurl_exec(). To calculate shipping, the application called the delivery service’s API synchronously, and under load that API took 15 to 20 seconds to answer. While processes waited for a shipping rate they stayed busy, and new requests kept arriving. The pool could not clear its queue, although the CPU never looked overloaded. - What was done
- To restore service we capped the wait for the external API at three seconds and temporarily replaced live rate calculation with fixed rates by zone. We also raised
pm.max_childrento leave more headroom for the peak.
- below 40%CPU and memory load during the failures
- 3 scap on the wait for the external API
In the PHP-FPM configuration, pm.max_children limits the number of requests served at the same time. A bigger pool needs more memory, so the value is chosen against the resources you have. The slow log comes from request_slowlog_timeout, which writes a PHP backtrace for any request that runs longer than the limit; it is off by default. Waiting on an outside integration is a separate problem, and we handled it on the API client’s side.
The first fix here was to cap the outside wait and give the shipping calculation a clear fallback. More processes complemented it. For another integration, the acceptable wait and the behaviour on failure should be chosen for what that integration does.
Case: an Excel export got the container killed for memory
CaseAnonymous caseSaaS platform
A large export and a memory limit
- What we saw
- In a second project the failure appeared only when users exported large reports. Users of the SaaS platform got a 502 from the Ingress when the Node.js application in its container suddenly dropped the connection.
- What we found
- The container’s memory use climbed sharply before each restart. Running
kubectl describe podshowed the reason for the termination,OOMKilled: the application had exceeded its 1 GB memory limit. That tied the 502 to the export. The Excel library first collected the whole data set in memory. - What was done
- We changed the export. PostgreSQL returned the rows through a cursor, and the application wrote them to a stream in batches. In this project memory use settled at about 150 MB.
- 1 GBmemory limit the export exceeded
- 150 MBmemory use after streaming
In Kubernetes, the node’s memory and a container’s own memory limit are separate things. A container may use more than it requested when the node has memory to spare, but it may not go beyond its limit, and one that keeps consuming past it is terminated. In the output of kubectl describe pod, look for Last State: Terminated with Reason: OOMKilled. In our case the pod’s state pointed at the export, and the fix changed how the data was processed.
How do you fix a 502 and prove the site has recovered?
The fix follows the cause you found. After it, repeat the request that used to fail and check the action that matters to the user. A successful answer from the homepage only confirms that page at that moment.

| What you see | What to find out | Direction of the fix |
|---|---|---|
| The proxy cannot connect to the application | Whether the process is running, whether the address or socket is right, whether busy workers have a queue | Restore the service or the route, and remove the reason the workers are busy |
| The connection drops during processing | Application errors, a process that exited, a memory limit | Fix the handler, the dependency or the resource use |
| Errors appear when an external service is called | Response time, the client’s settings, what should happen on failure | Cap the wait and provide a fallback |
| The proxy considers the response invalid | The matching log entry, the headers and the configuration at that hop | Fix the response format or the specific setting |
The Nginx proxy module has separate timeouts for connecting to the upstream (proxy_connect_timeout), for sending the request (proxy_send_timeout) and for reading the response (proxy_read_timeout), 60 seconds each by default, each applying to its own stage. Raising one does not bring back a process that has exited, and it does not free a busy pool. If a long operation is genuinely acceptable, agree its timeout at every hop that needs one.
Go back to the scenario that caused the 502: calculate shipping, build a large report or submit a form. Compare the response with the result of the operation and with the application log. A failure that comes in waves needs several repeats, because one successful request can easily fall between two failures.
To watch availability and the actions that matter after a fix, add the site to SENRIKO. Form checks run in a real browser on a site whose ownership you have verified, and the report shows which steps were confirmed. A CRM can confirm that a test lead arrived by sending a receipt from its rule. How often and how much SENRIKO checks depends on the plan.
Frequently asked questions about 502 errors
Can a visitor fix a 502?
Why does the site work after a restart and then fail again?
Is it enough to check that the server returns 200 again?
What is the difference between a 502 and a 504?
Does a 502 error hurt SEO?
Sources
- 502 Bad GatewayMDN Web Docs
- Error 502 or 504Cloudflare Support
- PHP: Configuration (FPM)PHP Manual
- Assign Memory Resources to Containers and PodsKubernetes Documentation
- Module ngx_http_proxy_modulenginx documentation
- How HTTP status codes affect Google’s crawlersGoogle Search Central