Contents
- Which metrics describe website loading speed?
- How do you check website speed with PageSpeed Insights?
- Case: a catalogue filter delayed the server’s response
- Case: an A/B-testing script left a white screen
- What should you fix first?
- How do you check the result and keep your forms working?
- Frequently asked questions about website speed
Checking a site’s speed starts with choosing a page and a measurable stage of the delay. We match the metrics against the network log and what the application is doing. In a catalogue this led us to a MySQL query, and on another page to an A/B-testing script in the head.
Which metrics describe website loading speed?
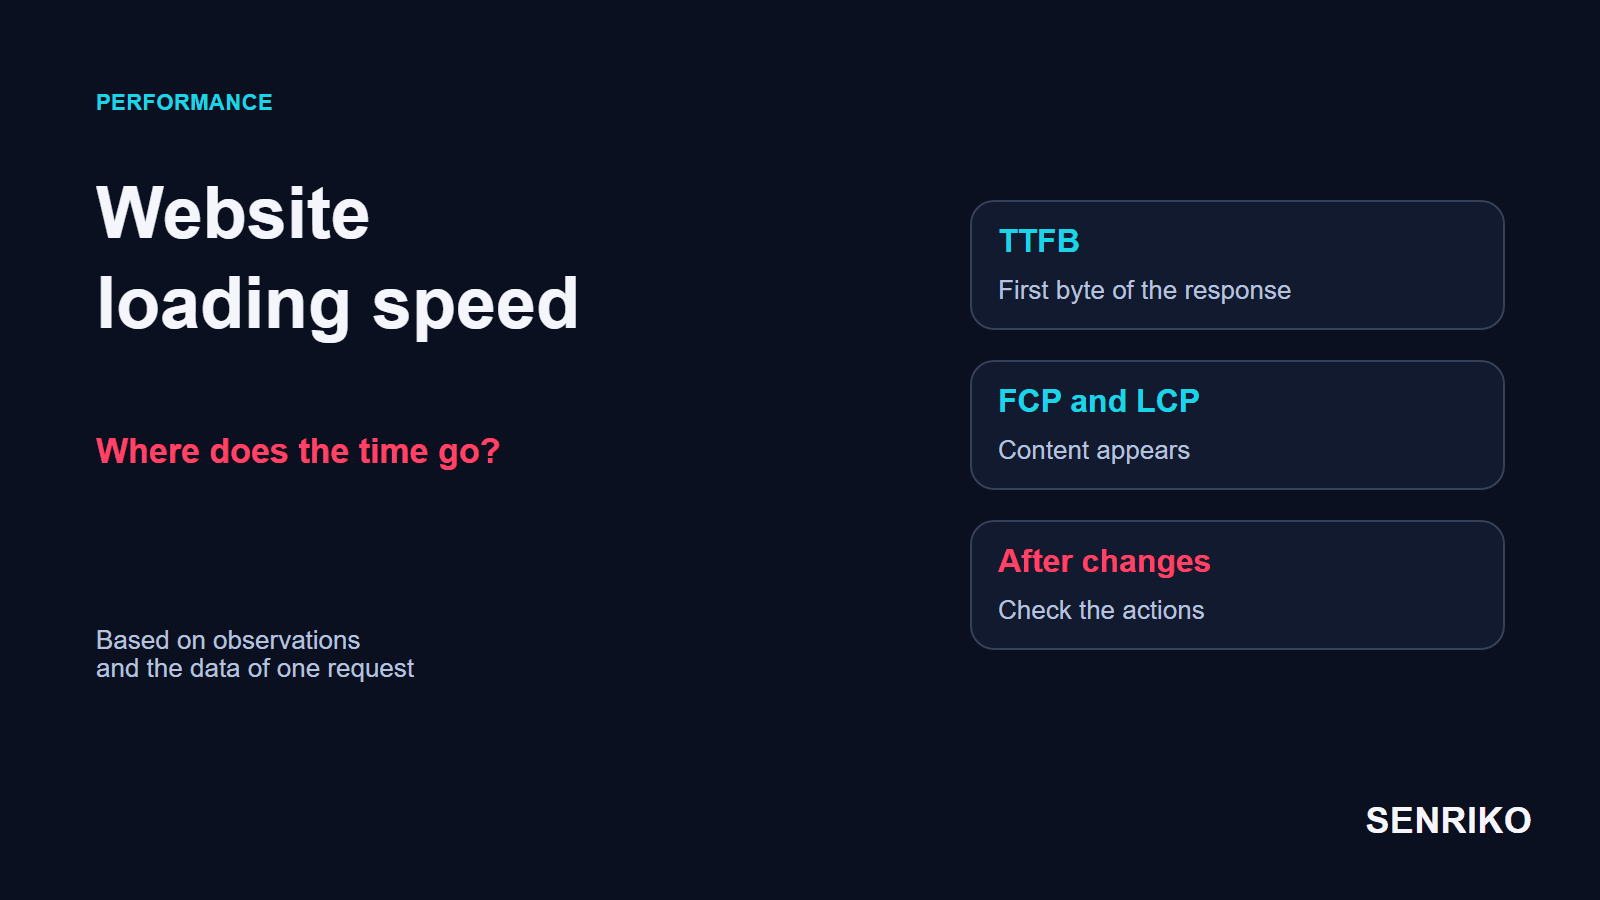
The server’s answer, the appearance of content and the reaction to an action happen at different stages. If the server is slow to answer, look at the path to the first byte; if the HTML has already arrived, find out what holds up the display. The metrics help you choose between the two.
| Metric | What it measures | What it is useful for |
|---|---|---|
| TTFB, Time to First Byte | The time until the first byte of the response arrives | Checking delays in connecting and in producing the response |
| FCP, First Contentful Paint | The time until the first content is drawn | Seeing how long the visitor waits for anything to appear |
| LCP, Largest Contentful Paint | The time until the largest visible block of content is drawn | Judging when the main image or text appears |
| INP, Interaction to Next Paint | The delay before the page reacts to interactions | Checking how responsive buttons and other controls are |
| CLS, Cumulative Layout Shift | How much the layout moves around | Finding unexpected jumps of the page while it is used |
The Core Web Vitals are LCP, INP and CLS. web.dev’s targets for good field values are an LCP within 2.5 seconds, an INP of 200 milliseconds or less and a CLS of 0.1 or less, each judged at the 75th percentile of page loads, the value that three quarters of visits meet. TTFB and FCP stay useful for diagnosis, but they belong to a different set of metrics.
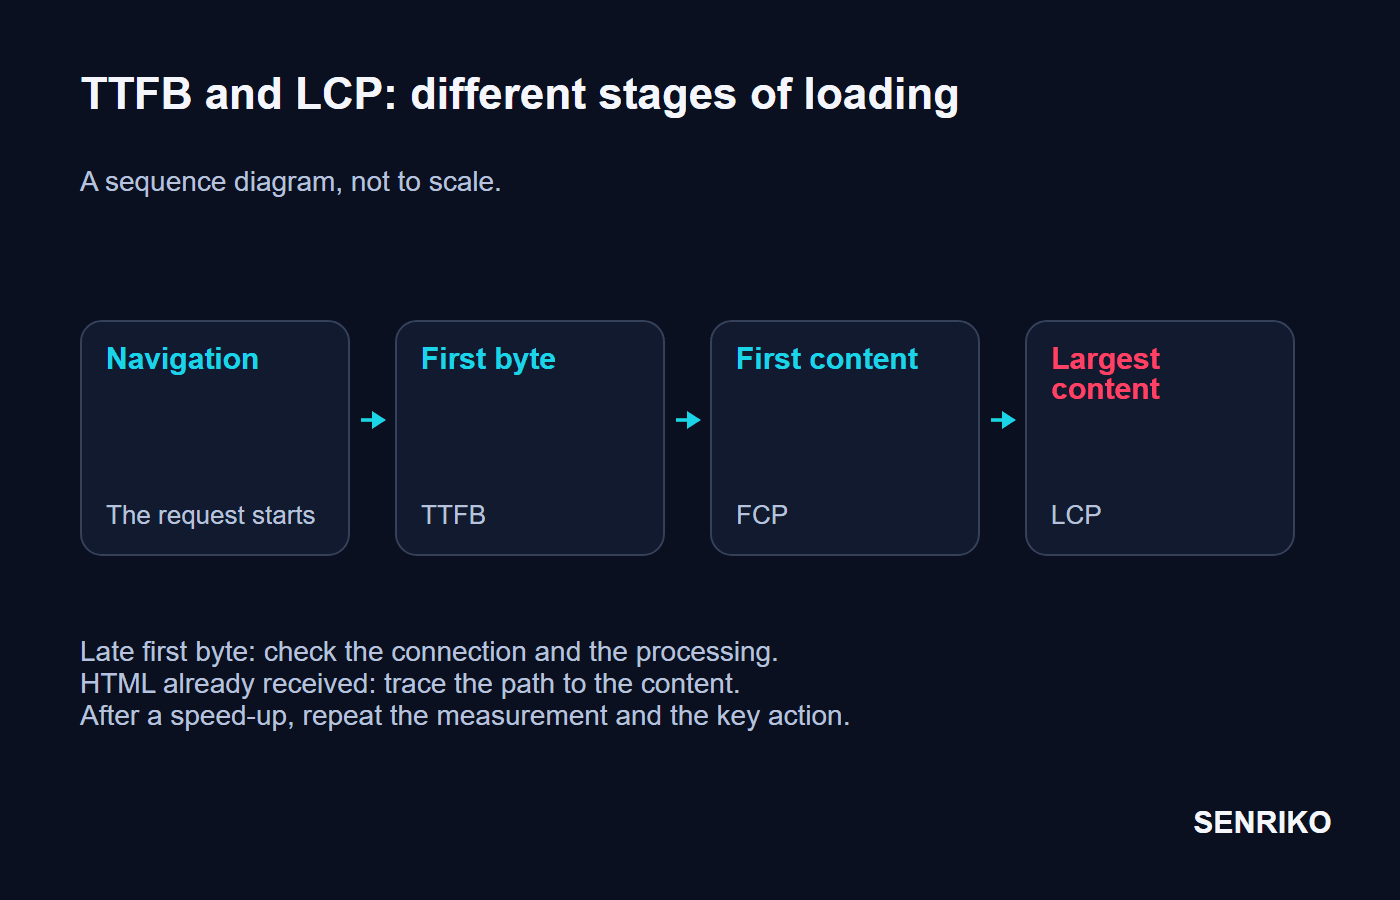
TTFB is made up of network and server stages: redirects, the DNS lookup, connecting and negotiating TLS, and the request up to the first byte. web.dev calls 0.8 seconds or less good and anything over 1.8 seconds poor. A high TTFB can come from the connection, from redirects or from how the request is handled, and it does not automatically mean you need a bigger server. First find out which stretch of the wait takes the time.
How do you check website speed with PageSpeed Insights?
Start with an important slow URL and PageSpeed Insights in its mobile mode. Read the real-user data and the Lighthouse lab run separately: they answer different questions.
Pick several pages by their role
An ad landing page, a category with filters, a product page, the checkout or a booking page. Measuring only the homepage can miss a delay that appears after the visitor moves into the catalogue.
Run the page
Open PageSpeed Insights and test the chosen address. Save the result, the date and the device mode, then compare the mobile and desktop results.
See whether there is real-user data
Look for field data for this URL. If there is not enough of it, the report may show data for the whole origin (the site with the same scheme, host and port), or have no field block at all.
Read the lab part
In the lab part, find the slow stages: the server response, the discovery of the main resource, blocking resources or long JavaScript work. Treat the overall score as a guide for a first look; for a fix you need specific observations.
Keep the conditions
For a before-and-after comparison, save the measurement conditions and take several runs in the same mode. For local diagnosis, keep the network, cache and device settings the same.
According to the PageSpeed Insights documentation, field data comes from the Chrome User Experience Report (CrUX) and covers the previous 28 days, while the lab test, which uses Lighthouse, shows a single load in a simulated environment. So after a fix the lab result can change at once, while the field figure still includes the old slow visits.
For a problem that appears after a filter, a click or another action, repeat that path in DevTools. The Network panel shows the requests and the wait for each response; Performance helps break down what the browser is doing. Keep the request or the part of the recording that shows the delay together with the automatic report.
Case: a catalogue filter delayed the server’s response
When the HTML arrives late, start with the wait for the response and the work done on the server.
CaseAnonymous caseAuto parts catalogue
Filtered pages took up to eight seconds
- What we saw
- In an auto parts catalogue, pages with filters took 5 to 8 seconds to open. Almost all of the wait was TTFB, while pages without filters were fast.
- What we found
- We turned on MySQL’s slow query log with a threshold of one second. It caught a catalogue query, shown below. It ran for about six seconds and processed about three million rows. The plan included a separate
filesort. There were indexes oncategory_idandbrand_id, but only separately, and they did not serve this lookup together with the sort by price. - What was done
- For this query we added a composite index on
(category_id, brand_id, price). In this project the query time fell to 15 ms and the page’s TTFB to 200 ms.
- 6 sfor the query, about 3 million rows
- 15 msfor the query after the composite index
- 200 msTTFB of the page after the fix
SELECT * FROM parts
WHERE category_id = 15 AND brand_id = 4
ORDER BY price DESC
LIMIT 20;
The point of the fix is to match the index to this condition and this order. MySQL’s manual on multiple-column indexes explains how the leading columns of a composite index are used, and its page on ORDER BY optimisation says that Using filesort in the Extra column of EXPLAIN means an index was not used for the sort. Before adding an index, look at the query plan and the real execution: a different combination of filters may need a different solution.
EXPLAIN SELECT * FROM parts
WHERE category_id = 15 AND brand_id = 4
ORDER BY price DESC
LIMIT 20;

ALTER TABLE parts ADD INDEX category_brand_price (category_id, brand_id, price);
The delay came before any HTML existed, so we began with how the database ran the query. After the change we measured both the query and the page’s response: those measurements tied the technical fix to the visitor’s wait. Work on images could be judged at the next stage of loading.
Case: an A/B-testing script left a white screen
A fast server response still has to be parsed by the browser.
CaseAnonymous caseSite with a third-party A/B service
A white screen despite a fast server
- What we saw
- On another site the HTML arrived quickly, but the main content appeared after a long delay. In PageSpeed’s mobile lab test, LCP reached 12 seconds.
- What we found
- The Network panel, with network throttling on, showed a third-party A/B-testing script in the
head. It was an ordinary external script, with neitherasyncnordefer. Its file, about 50 KB, took more than four seconds to load, and HTML parsing waited for it to download and run. - What was done
- We set the integration to load asynchronously and to show the content by default until the tests initialised. The other non-critical scripts got
defer. After the fix, in the mobile lab measurement, FCP was 1.5 seconds and LCP fell to 2.5 seconds. Those are two different results: the first content and the main content appearing.
- 12 sLCP in the mobile lab test before the fix
- 2.5 sLCP after the fix
- 1.5 sFCP after the fix
An ordinary external script with neither attribute is fetched and run before the browser carries on parsing the page, so loading it and running it hold up everything after it. async fetches the file in parallel and runs it as soon as it is ready, with no guarantee of order between independent files, and running it can still occupy the main thread.
defer fits when a script needs the parsed document, or a fixed order among deferred scripts. It also allows parallel downloading, and the scripts run in document order once parsing is done. So putting async on a whole set of files is risky: one script can run before the one it depends on.
With an A/B integration, both the loading method and what the page shows before the experiment is ready matter. Check whether the content stays available while the third-party service is answering. In our project the regular version of the page showed until the test initialised, and we confirmed the result with separate FCP and LCP measurements.
What should you fix first?
Choose the fix by the stage that takes longest and by how much the page matters. First remove the delay that stops the visitor getting or using the content they came for. Then measure again and move to the next noticeable constraint.
| What you see | First check | Possible direction of work |
|---|---|---|
| The first byte arrives late | The time to connect and the time the request takes to run | Database queries, external dependencies, caching, infrastructure |
| The HTML is fast, but the main content appears late | When the LCP resource is discovered and loaded | Resource priority, the size of the main image, blocking styles |
| JavaScript loads or runs for a long time before the content | The sequence in Network, and the work of the main thread | How scripts are loaded, dependencies, the amount of code that runs |
| The page is visible but reacts poorly to actions | Interaction delays and long tasks | Handler code and the work of the main thread |
Do not lazy-load the main image
Do not defer the main LCP image with loading="lazy": the browser may discover it later, and the main content will appear later with it. For images below the first screen, lazy loading can be the right choice. web.dev’s guidance on LCP ties the choice to when a specific resource is discovered and how it is prioritised, and suggests fetchpriority="high" on the image likely to be the LCP element, for one or two images at most.
The same guidance splits LCP into four parts: TTFB, resource load delay, resource load duration and element render delay. On a well-optimised page TTFB and the load duration take about 40% of the time each, and the two delays stay under 10% each, which is a quick way to see which part is out of proportion.
For a slow query, start with its plan and how it runs. For late display of HTML that has already arrived, work out the browser’s path to the content. Then choose work on images, JavaScript or caching by the delay that is left, and measure again after each change.
How do you check the result and keep your forms working?
Repeat the measurements in comparable conditions and check the action that matters to the user. Fast loading does not confirm that sending the form and the analytics event still work after scripts have been moved.
For the control comparison, write down the URL, the device mode, the network conditions, the metrics you chose and the changes. Compare several lab runs. Look at field data separately, bearing in mind the 28-day window and which URL or origin the report shows.
Then walk the customer’s path: open the page, use the filter, fill in the form or finish the checkout step that matters. Check the result on the server and that the expected event appears. For a payment, compare the order status with the payment system, rather than stopping at the thank-you page loading.
After you change tags, use the free GA4 checker from SENRIKO: it shows the visible IDs and the events sent during a browser visit. It does not submit a form.
To check a form regularly, along with the signal it should produce, add the site to SENRIKO’s monitoring once its ownership is verified.
Keep two results of the control check: the loading measurements and a pass of the action that matters. In our filter case the reference values were the MySQL query time and the TTFB; when scripts are moved, the form and the expected event are added to the measurement.
Frequently asked questions about website speed
What is a good website loading speed?
Does page speed affect SEO?
Why does my PageSpeed score differ from what real visitors get?
Is TTFB a Core Web Vital?
Sources
- About PageSpeed InsightsGoogle for Developers
- Web Vitalsweb.dev
- Time to First Byte (TTFB)web.dev
- Optimize Largest Contentful Paintweb.dev
- <script>: the script elementMDN Web Docs
- Multiple-Column IndexesMySQL 8.4 Reference Manual
- ORDER BY OptimizationMySQL 8.4 Reference Manual
- Understanding Google Page ExperienceGoogle Search Central